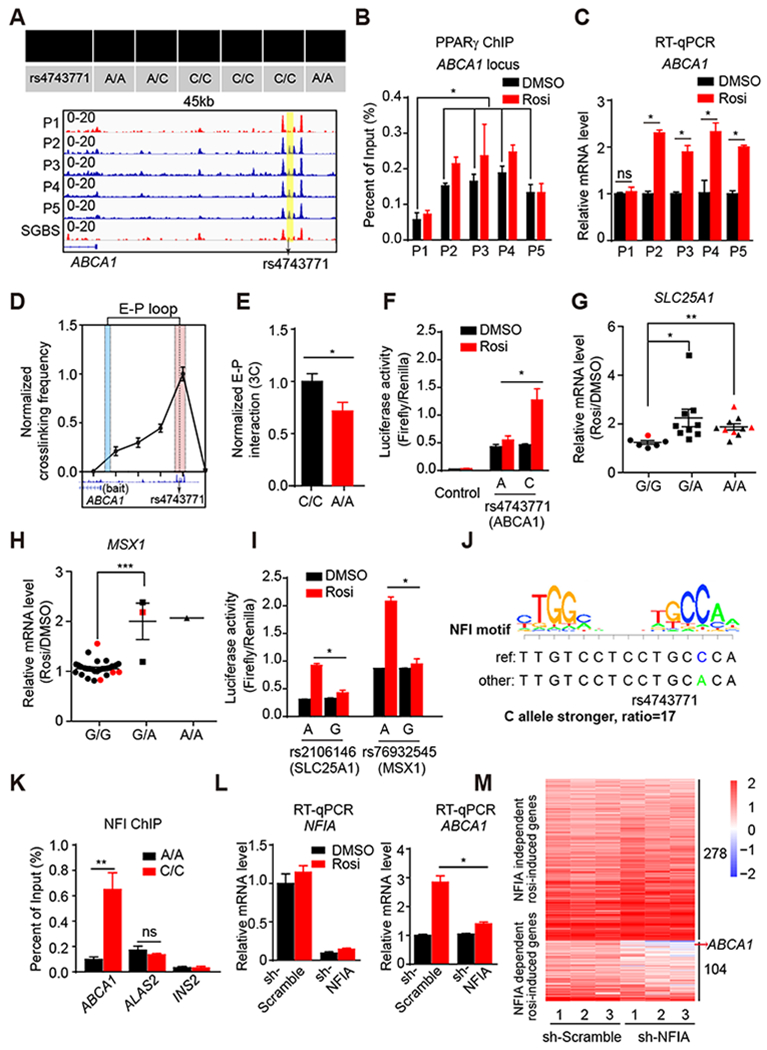
Figure 3. Genetic variants determine differential PPARγ occupancy by modulating binding of NFIA.

(A) The genotype of rs4743771 in all five patients and SGBS cell line (upper panel). Visualization of a Pi-specific absent peak region (yellow box) at ABCA1 loci across patients and SGBS cell line (bottom panel). Black arrow indicates the position of rs4743771.
(B) PPARγ ChIP-qPCR for ABCA1 in all five patient-adipocytes treated with DMSO or Rosi (n=3).
(C) mRNA expression of ABCA1 in five patient-adipocytes treated with DMSO and Rosi (n=3), normalized to HPRT, DMSO was set to 1, as measured by RT-qPCR.
(D) Enhancer-promoter loop (E-P loop) identified between the region near rs4743771(red) and ABCA1 gene promoter (blue) by 3C in C/C patient adipocytes (n=4).
(E) E-P loop in A/A and C/C patient adipocytes (n=5). E-P interactions were normalized to the intragenic interaction at the TBP locus.
(F) The activities of luciferase reporters with the different alleles for rs4743771 and control reporter PGL4.24 in 3T3-L1 adipocytes treated with DMSO or 1μM rosi.
(G and H) mRNA expression of SLC25A1 (G) and MSX1 (H) in hASC-derived adipocytes from 25 patients. Red dots represent patients P1-P5. Data are expressed as mean ± SEM of Rosi/DMSO fold change.
(I) The activities of luciferase reporters with the different alleles for rs2106146 and rs76932545 in 3T3-L1 adipocytes treated with DMSO or 1μM rosi.
(J) The putative effect of rs4743771 on NFI binding.
(K) NFI ChIP-qPCR for ABCA1, ALAS2 and INS2 in 3 patient-adipocytes carrying A/A and 3 patient-adipocytes carrying C/C.
(L) mRNA expression of NFIA and ABCA1 in NFIA knocked-down adipocytes treated with rosi (n=3), normalized to HPRT, as measured by RT-qPCR.
(M) Heat map of rosi-induced genes in control adipocytes and NFIA-depleted adipocytes treated with either DMSO or 1 μM Rosi.
RT-qPCR, ChIP-qPCR, luciferase reporter and 3C data are expressed as mean ± SEM. (*) p < 0.05, (**) p < 0.01, (***) p < 0.001, (ns) p > 0.05 in Student’s t-test.
See also Figure S4.
