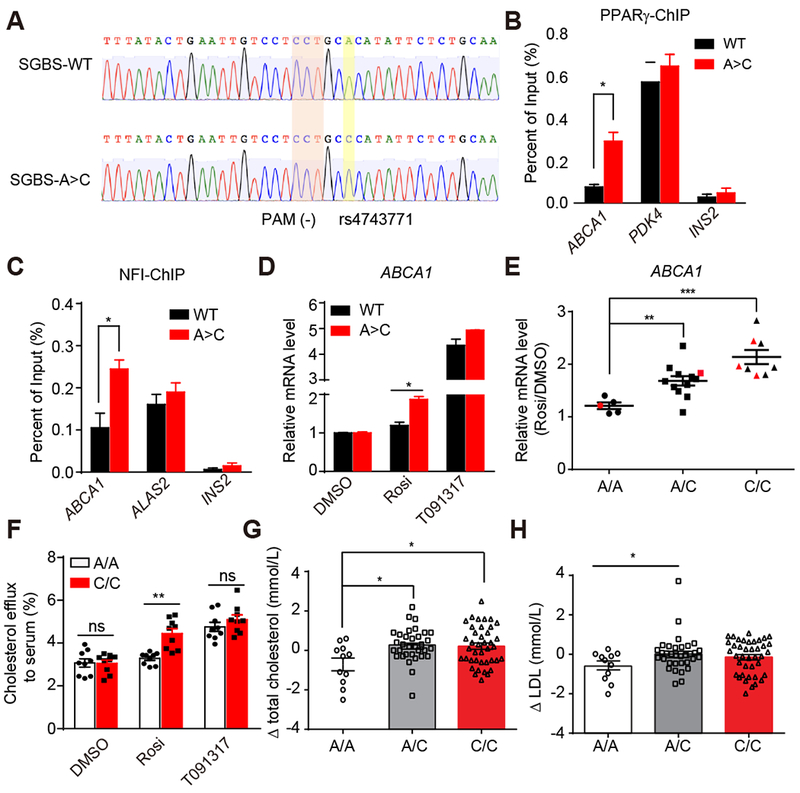
Figure 4. Genetic variants determine and predict individual differences in rosi responsiveness.

(A) Sanger sequencing validation of the correction of A/A allele to C/C allele.
(B and C) PPARγ (B) and NFI (C) ChIP-qPCR for ABCA1, PDK4, ALAS2, and INS2 in SGBS WT and SGBS A>C adipocytes.
(D) mRNA expression of ABCA1 in SGBS WT and SGBS A>C adipocytes treated with DMSO, 1μM rosi or 10μM T091317 (n=3).
(E) mRNA expression of ABCA1 in hASC-derived adipocytes from 25 patients. Red dots represent patients P1-P5. Data are expressed as mean ± SEM of Rosi/DMSO fold change.
(F) Cholesterol efflux to serum in 3 patient-adipocytes carrying A/A and 3 patient-adipocytes carrying C/C treated with DMSO, 1μM rosi or 10μM T091317 (n=3).
(G and H) The change of total cholesterol (G) and LDL (H) levels after rosi treatment in patients carrying different rs4743771 genotypes.
RT-qPCR, ChIP-qPCR data are expressed as mean ± SEM. (*) p < 0.05, (**) p < 0.01, (***) p < 0.001, (ns) p > 0.05 in Student’s t-test.
See also Figure S4.
