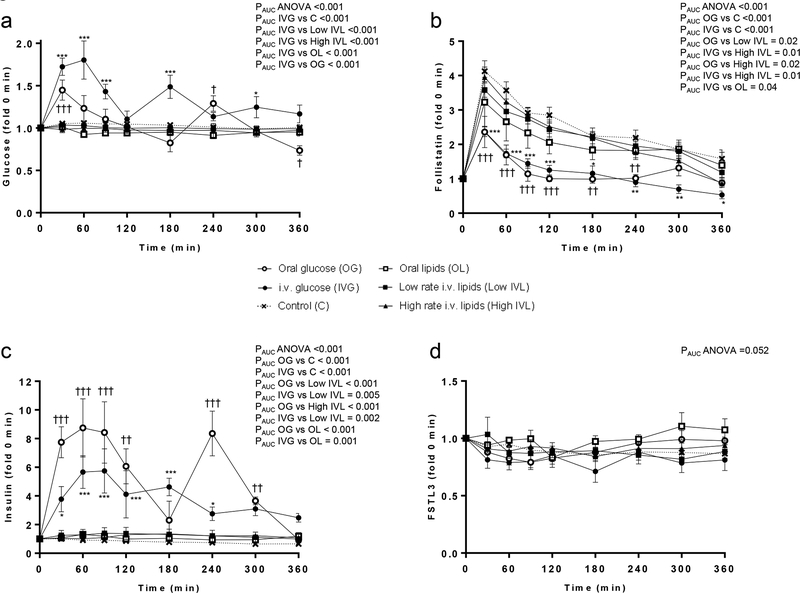
Figure 1:
Circulating profile of glucose (a), FST (b), Insulin (c), and FSTL3 (d) after oral or intravenous glucose or lipid intake vs control.
PAUC ANOVA indicates the p value from one-way ANOVA of the area under the curve (AUC) between all groups; PAUC one group (e.g. IVG) vs PAUC another group (e.g. C), indicates the p value of the post-hoc Tukey’s test between the AUCs of the two groups; Tukey’s test for the specific timepoint between oral glucose group vs control: †, p<0.05; ††, p<0.01; ††† <0.001. Tukey’s test for the specific timepoint between intravenous glucose group vs control: *, p<0.05; **, p<0.01; ***, p<0.001.

