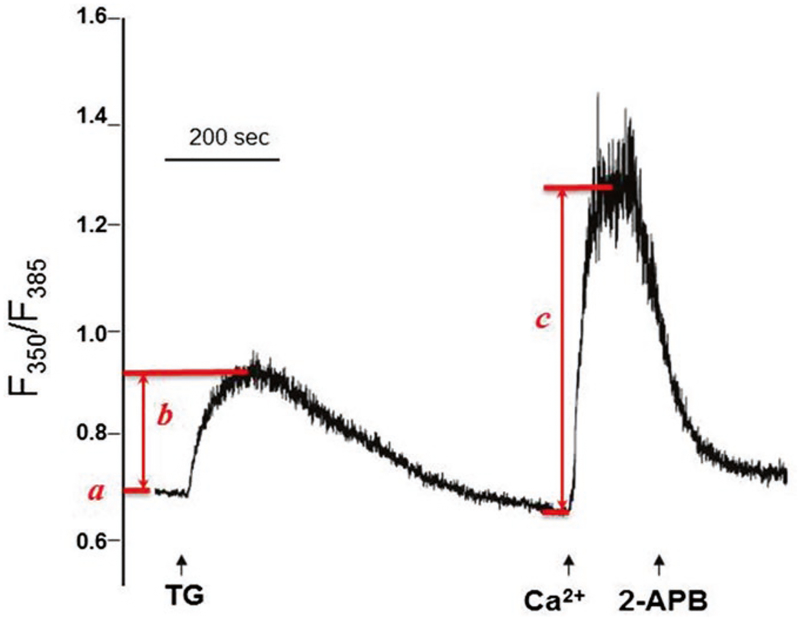
Fig. 1.
Intracellular Ca2+ measurement reveals SOCE in KYSE-150 cells. The initial ratio of F350/F385 represents resting intracellular Ca2+ (a). Addition of TG (indicated by first arrow) in BSS-EGTA bath solution induces passive Ca2+ release from ER. The TG-sensitive ER Ca2+ stores can be displayed as ΔF350/F385 (b). After ER Ca2+ stores are completely depleted (~900 s), addition of extracellular 2 mM Ca2+ (indicated by second arrow) activates a sustained intracellular Ca2+ elevation through SOCE, which can be represented by ΔF350/F385 (c). This SOCE can be blocked by SOCE inhibitor 2-APB (indicated by third arrow)

