Fig. 2.
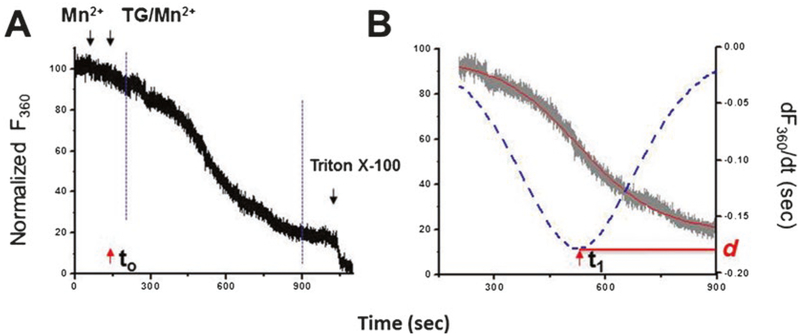
Mn2+ quenching assay reveals graded activation of SOCE in C2C12 myotubes. (a) The decay slope of Fura-2 fluorescence is measured at the Ca2+-independent excitation wavelength 360 nm of Fura-2 (F360). Addition of Mn2+ only (indicated by first black arrow) is recorded as baseline; the completely quenched fluorescence signal is established at the end of each experiment by lysing the cells with 0.1% Triton X-100 (as 0%). Simultaneous application of TG and Mn2+ (second black arrow, t0) results in a gradually accelerated decay of fluorescence until reaching a maximal quenching rate. The gradual developed Mn2+ quenching can be extracted for further analysis (between dashed blue lines). (b) The extracted trace of F360 can be fitted in a sigmoidal curve (red line). The activation of SOCE is expressed as percentage decrease in fluorescence per unit time (the initial value as 100%). To quantify the graded activation of SOCE, the first-order derivative of changes, dF360/dt, is determined (blue dotted curve). This analysis provides two useful kinetic parameters: SOCE (d), the peak slope of Mn2+ quenching, and Δτ, the duration from initiation of TG-induced Ca2+ release (t0) to the point where SOCEmax is reached (t1)

