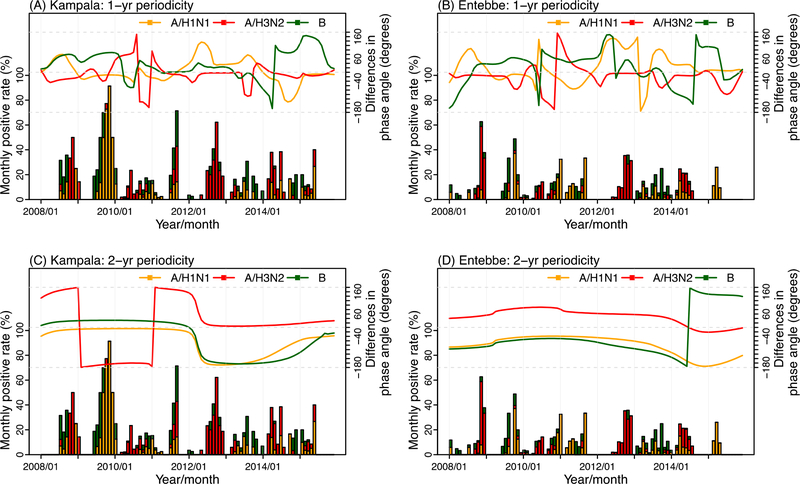
Figure 3.
Wavelet phase angle differences between the overall influenza epidemic and each of the three influenza (sub)types. The lines show the wavelet phase angle differences at 12±6 month periods (upper panel: A for Kampala and B for Entebbe) or 24±6 month periods (lower panel: C for Kampala and D for Entebbe) between the overall influenza epidemic and A/H1N1 (in orange), A/H3N2 (in red), or B (in green). The bars show monthly influenza viral positive rates, with each colored segment representing viral positive rate for each of the three influenza (sub)types: A/H1N1 (in orange), A/H3N2 (in red), and B (in green).

