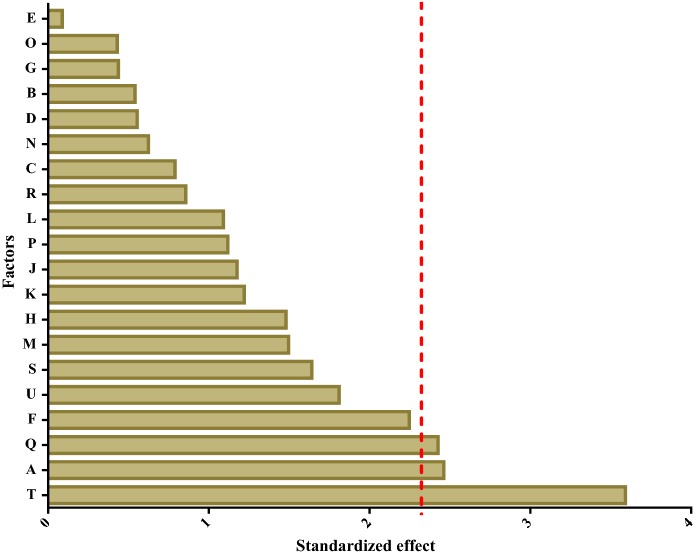
Fig. 1.
The effect of factors in the medium. Normal plot of the standardized effects of cell growth factors in a Plackett–Burman design (The significance level of each variable effect was determined using t distribution associated with Student’s t-test,; The red vertical line means the t critical value (α = 0.1). (Color figure online)

