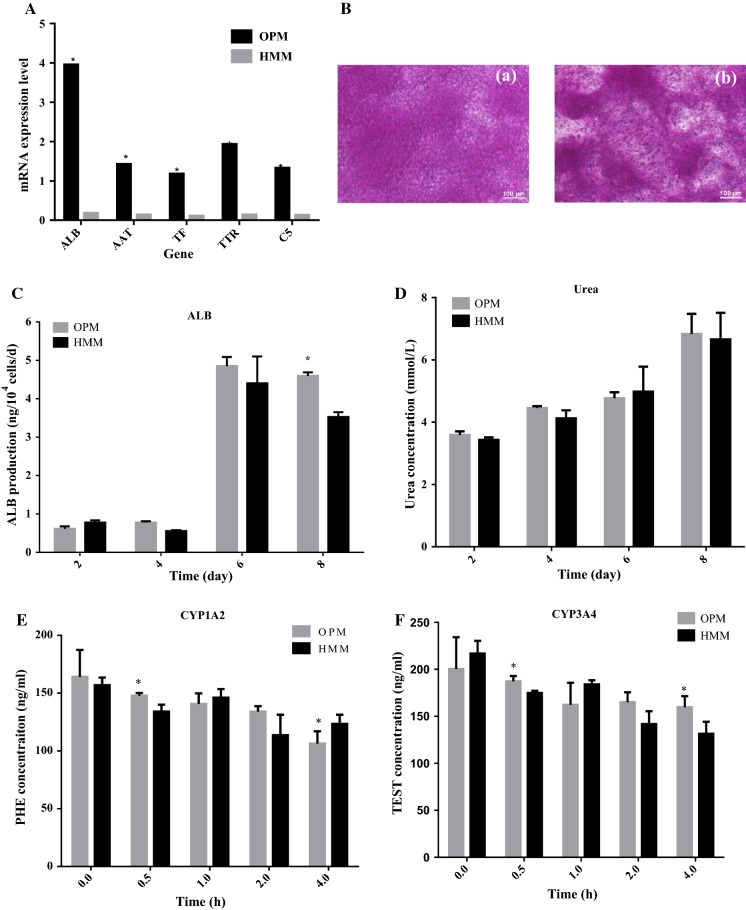
Fig. 6.
Assessment of hiHep cell functionality. A Liver-specific gene analysis by semi-quantitative PCR; B Cells on day 8 showed the capability to store glycogen, as seen in the areas stained in pink. (a) OPM, (b) HMM; C Albumin secretion during the culture process; D Urea production during the culture process; E CYP1A2 activity; F CYP3A4 activity (The activity of CYP was reflected by the reduction of corresponding substrate concentration, the greater variation means the higher activity). *p < 0.05 versus HMM

