Fig. 2.
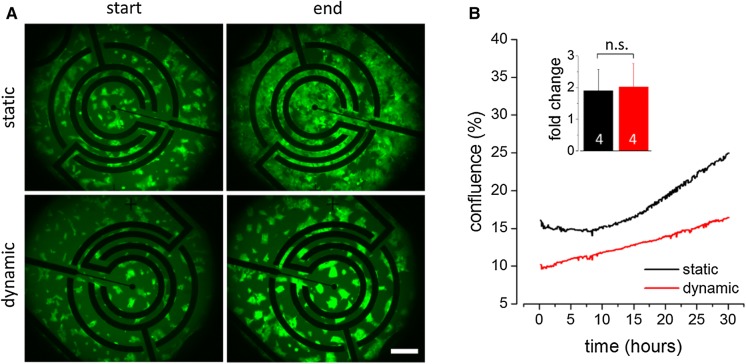
Comparative analysis of cellular growth characteristics of HEK293YFPI152L cells at static versus periodic culturing conditions. a Representative fluomicrographs of HEK293YFPI152L cells cultured in multi-parametric cell chips in static (upper row) and periodic (bottom row) culture mode at experiment initiation (start) and after 30 h imaging duration (end). Scale bar: 200 µm. b Time courses of the average confluence (in %, mean ± SD, N = 4) of cells cultured in static (black) and periodic (red) culture mode, respectively, calculated from images as shown in (a). The time courses indicate exponential and linear growth for cells cultured in static and periodic mode, respectively. The inset histogram displays the average fold-change in growth area (mean ± SD, N = 4) and indicates that the final growth area is comparable for both culture conditions after 30 h culture duration. ‘n.s.’: not significant. (Color figure online)

