Fig. 3.
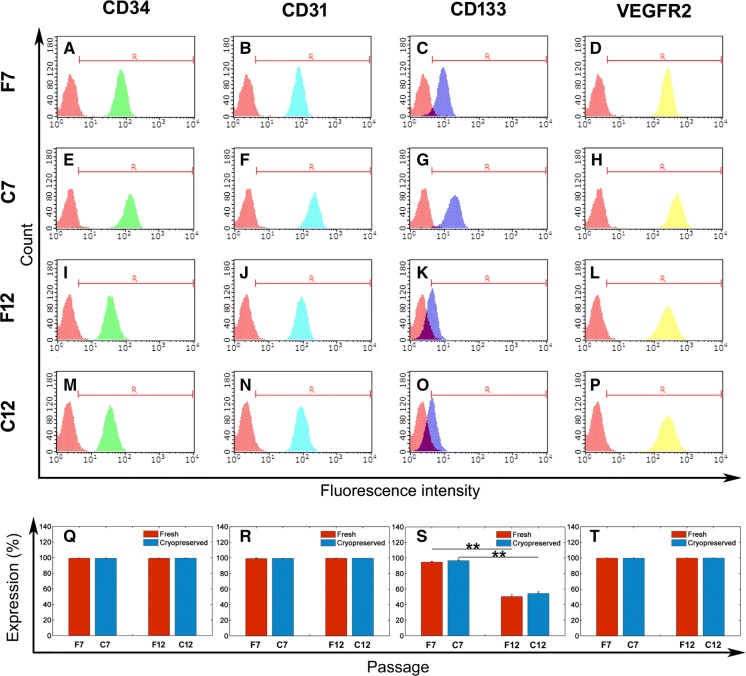
Flow cytometry analysis of cell surface marker of EPCs after a limited number of passages and cryopreservation. A–P Representative results of flow cytometry analysis of CD34 (green), CD31 (light blue), CD133 (dark blue), and VEGFR-2 (yellow) on EPCs. Cells were incubated with antibodies to CD34, CD31, CD133, and VEGFR-2, and then labeled with FITC-conjugated secondary antibodies. The red peak: negative control. Similar results were obtained for at least three experiments. Percentage of cells positive to CD34 (Q), CD31 (R), CD133 (S), and VEGFR-2 (T) determined by comparison with corresponding negative control labeling (data are presented as mean ± SD, n = 3), **significant difference between passage 7 and 12 at p < 0.01. (Color figure online)

