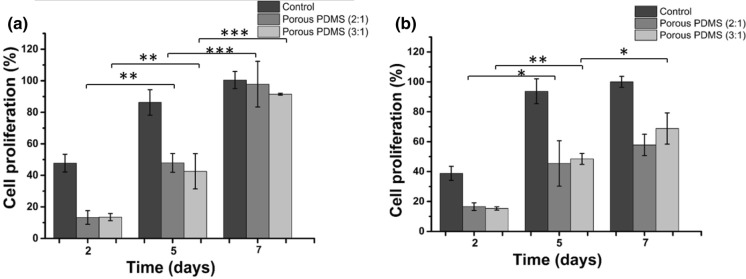
Fig. 3.
The representative graph shows cell proliferation within the PDMS based scaffold using the MTT assay a L929 fibroblast cells and b B16-F10 melanocyte cells cultured within the fabricated scaffolds with different salt to pre-polymer PDMS ratios (w/w) after 2, 5 and 7 days of culture. Cells cultured in wells (i.e., without scaffold) were considered as a control. The percentage of cell proliferation was calculated by the ratio of absorbance of test sample to the absorbance of control (at 7 days). Experiments were performed in triplicates for both cell types along with their respective controls. Data represent mean ± standard deviation of three independent experiments. The statistical differences between the same type of scaffold at different time of culture are represented by *p < 0.05; **p < 0.01; ***p < 0.001

