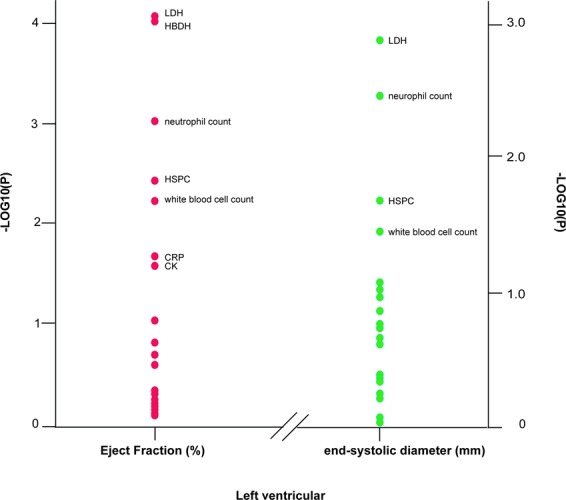
Figure 5.

−Log10(p) probability plot of the multivariable-adjusted associations of various indexes of left ventricular function with the biomarkers. −Log10(p) probability plot of the multivariable-adjusted associations of various indexes of left ventricular function with the biomarkers in CHD patients. All analyses were adjusted for covariables, including age, sex, mean arterial pressure, heart rate, plasma glucose, serum creatinine, plasma glucose, γ-glutamyltransferase, smoking, alcohol intake, history of hypertension (1 or 0), history of diabetes (1 or 0), use of diuretics, inhibitors of the renin–angiotensin system (β-blockers, angiotensin-converting-enzyme inhibitors and angiotensin type1 receptor blockers), vasodilators (calcium-channel blockers and α-blockers), metformin and statins. With the exceptions of LDL-c and HDL-c, all other biomarkers were additionally adjusted with total-to-HDL-c ratio. Biomarkers in Fig. 3 as well as creatinine kinase (CK), brain natriuretic peptide (NT-pro-BNP), lactic dehydrogenase (LDH), α-hydroxybutyrate dehydrogenase (HBDH) and cardiac troponin I (TnI) were analysed and those with p < 0.05 are named here.
