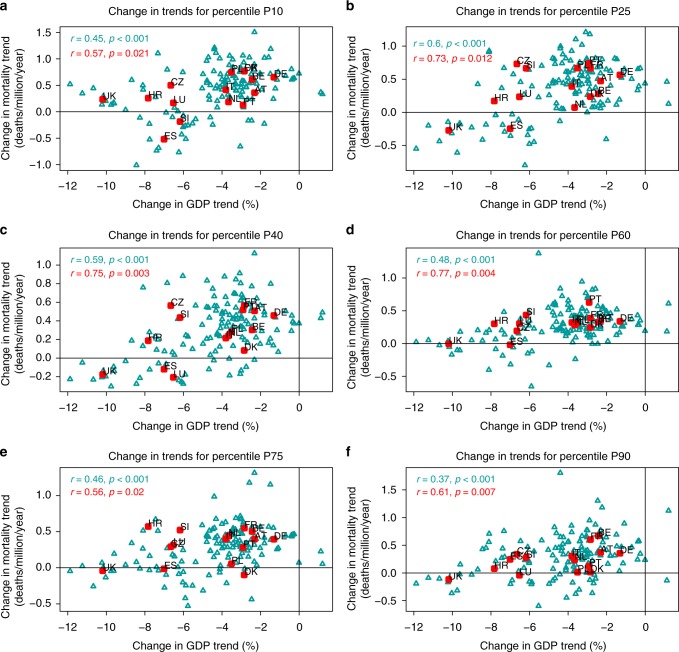
Fig. 4.
Change in trends by temperature percentile. Panels show the difference (recession minus expansion) in the trend of Gross Domestic Product (GDP, %) and age-standardized mortality (daily deaths per million per year) for temperature percentiles 10 (a), 25 (b), 40 (c), 60 (d), 75 (e), and 90 (f) by country (red squares) and region (cyan triangles). Pearson correlations and p-values are depicted in the top-left corner. Country acronyms are: Austria (AT), Belgium (BE), Croatia (HR), the Czech Republic (CZ), Denmark (DK), France (FR), Germany (DE), Italy (IT), Luxembourg (LU), Netherlands (NL), Poland (PL), Portugal (PT), Slovenia (SI), Spain (ES), and the United Kingdom (UK)

