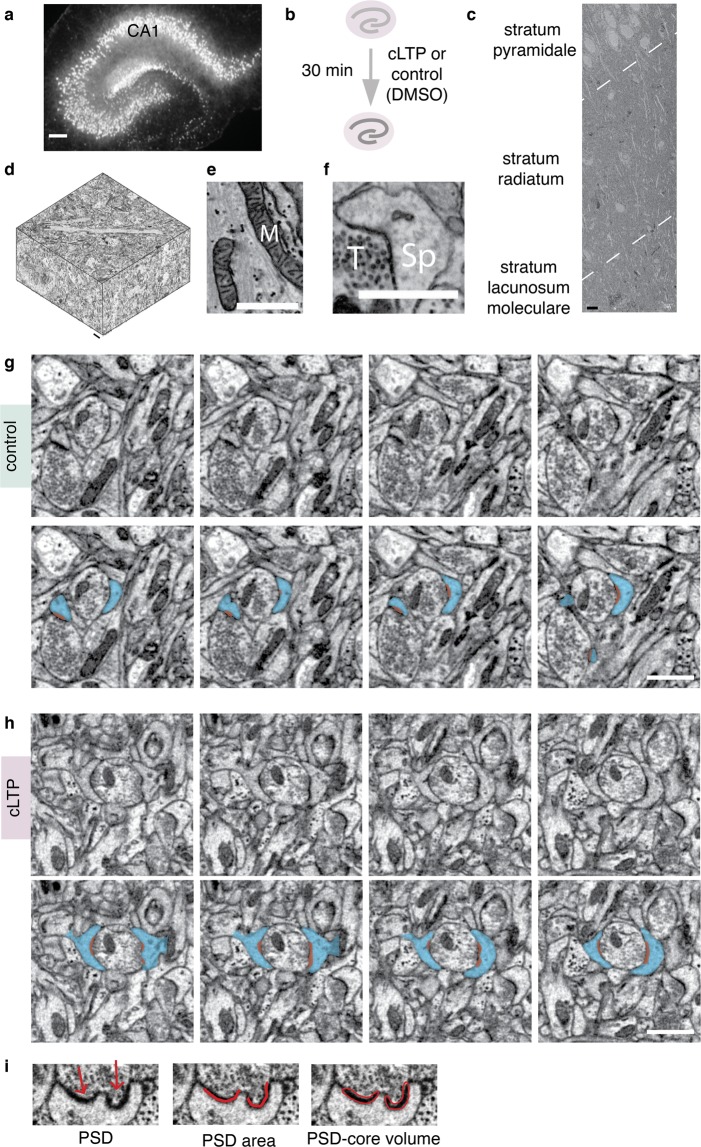
Figure 1.
3D Serial Block-Face scanning electron microscopy of dendritic spines and core compartment of postsynaptic densities (PSD-core) in the organotypic hippocampal slices (OHCs). (a) Experimental design: OHC were treated with cLTP (n = 4) or DMSO (control, n = 4) for 30 min and then fixed. (a) OHC transfected with AAV1/2_CaMKII-mCherry to show its morphology. Scale bar, 200 μm. For 3D EM, only non-transfected OHC were used. (c) Low-magnification (5k) electron microphotograph of CA1 region of the organotypic slices showing conserved morphology. Dashed lines denote borders between strata. Scale bar, 10 μm. (d) 3D reconstruction of a full SBEM scan. Scale bar, 1 μm. (e,f) High magnification (25k) images of neuropil; M – mitochondrion, Sp – dendritic spine, T - axon terminal. Scale bars, 1 μm. (g,h) Consecutive images from SBEM scans with examples of dendritic spines from (g) control and (h) cLTP sample. Example dendritic spines are marked in blue and the PSDs are marked in red. Scale bars, 1 μm. (i) Example of a PSD segmentation (from a scan). Arrows indicate two parts of a perforated PSD. PSD-core volume was measured by outlining the electron-dense PSD core. PSD area was annotated with open traces along PSD opposing active zone (see methods for details).

