Figure 2.
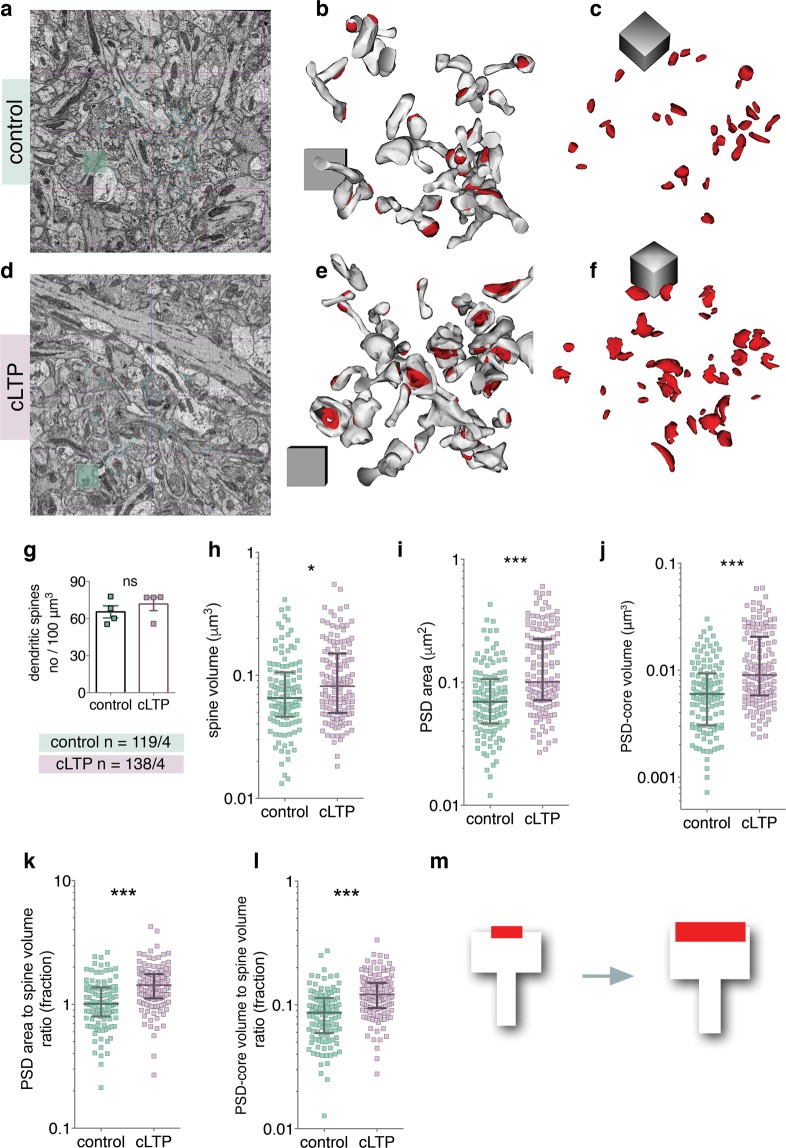
NMDAR-cLTP enlarges dendritic spines and their PSDs. (a,d) Fields of view of SBEM scan. (b,e) Example reconstructions of spines (white) with PDS-coress (red) from bricks of the control and cLTP-treated OHCs. Cubes are 1 × 1 × 1 μm. (c,f) PSD-core reconstructions from the same samples. (g) Spine density is not affected by cLTP (t-test, t(6) = 0.88, p = 0.41). (h) Spine volume is increased in the stimulated group (Mann-Whitney test, U = 6838, p = 0.02) as are the parameters of the PSD-core: (i) area (Mann-Whitney test, U = 4922, p < 0.0001) and (j) volume (Mann-Whitney test, U = 4969, p < 0.0001). (k) PSD area to dendritic spine volume ratio (Mann-Whitney test, U = 4708, p < 0.0001) and (l) PSD-core volume to dendritic spine volume ratio increases during cLTP (Mann-Whitney test, U = 4476, p < 0.0001). (m) cLTP in OHC is linked with slight increase of spine volume (white) and a large increase of PSD-core volume and area (red). *p < 0.05, ***p < 0.001. Mean ± SEM are shown for (g), median ± IQR for (h–l). Axes are log10.

