
Figure 3.
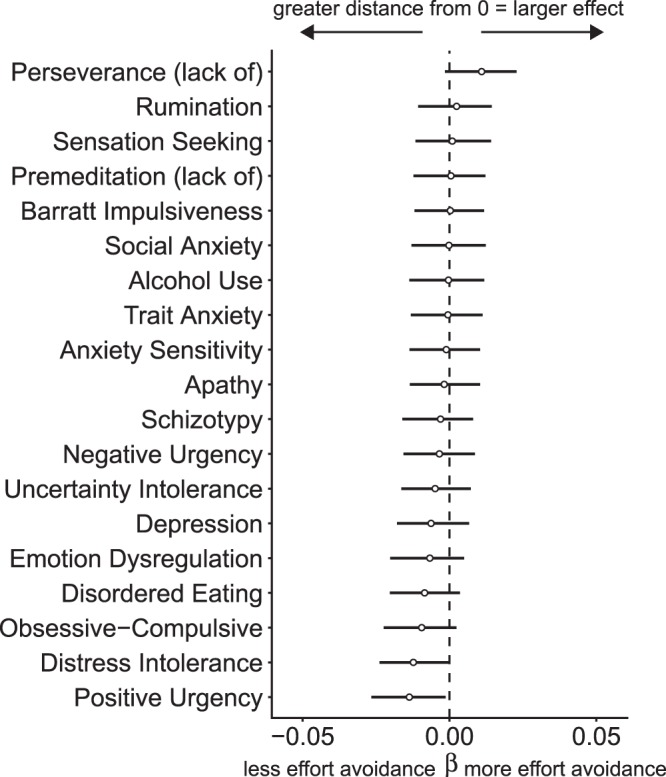
Coefficient plot where the beta indicates the estimated slope of the line relating severity of the self-report measures and proportion of low demand choices while controlling for age, IQ, and gender. Credible intervals are displayed containing 95% of the posterior probability density around the mean, organized according to ascending coefficient mean. Negative beta intervals are evidence for less demand avoidance (more mental effort) and positive beta intervals are evidence for more demand avoidance (less mental effort).