
Fig. 1.
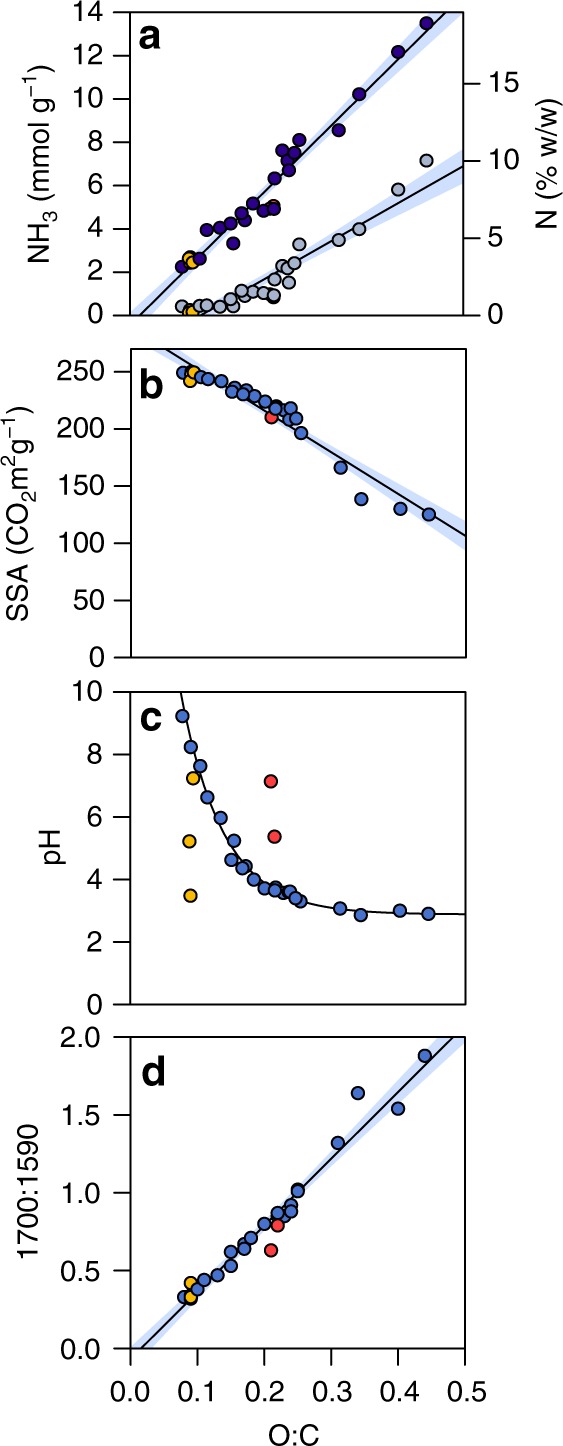
Changes in pyrogenic organic matter ammonia retention and physiochemical characteristics as a function of molar O:C ratio. a ammonia (NH3) retention capacity—expressed in mmol of NH3 g−1 of pyrogenic organic matter-carbon (PyOM–C, left y axis) and percent nitrogen (N) of PyOM–C (right y axis)—increases as a function of molar O:C ratio. Each point represents the average oxygen:carbon (O:C) ratio for two replicates. NH3 chemisorption = 17.49x − 1.84, R2 = 0.89, p < 0.001, F1,25 = 204.7, S25 = 0.59 (light blue); NH3 combined chemical and physical adsorption = 30.51x − 0.44, R2 = 0.96, p < 0.001, F1,25 = 567.2, S25 = 0.62 (dark blue). b Specific surface area (SSA) decreases as PyOM O:C ratio increases. SSA = −365x + 288.8, R2 = 0.931, p < 0.001, F1,25 = 338.5, S25 = 9.591. c PyOM pH decreases as oxidation increases. Blue symbols represent unoxidized PyOM and PyOM incubated with deionized water (DIH2O) and hydrogen peroxide (H2O2) and are fitted with a significant curve (y = 20.8*e−14.8(O:C) + 2.84, S19 = 0.199). d The intensity of Fourier transform infrared (FTIR) peak heights associated with C=O stretching (1691–1715 cm−1) increases in proportion to the intensity of peak heights associated with C=C vibrations and stretching (1582–1609 cm−1) as PyOM O:C ratio increases (y = 4.29x − 0.0670, R2 = 0.963, p < 0.001, F1,25 = 650, S25 = 0.081). For all figures, yellow symbols represent PyOM that was incubated with 1 M hydrochloric acid (HCl); pink symbols represent PyOM that was incubated with H2O2 and then with 1 M sodium hydroxide (NaOH); shaded bands represent the 95% confidence intervals