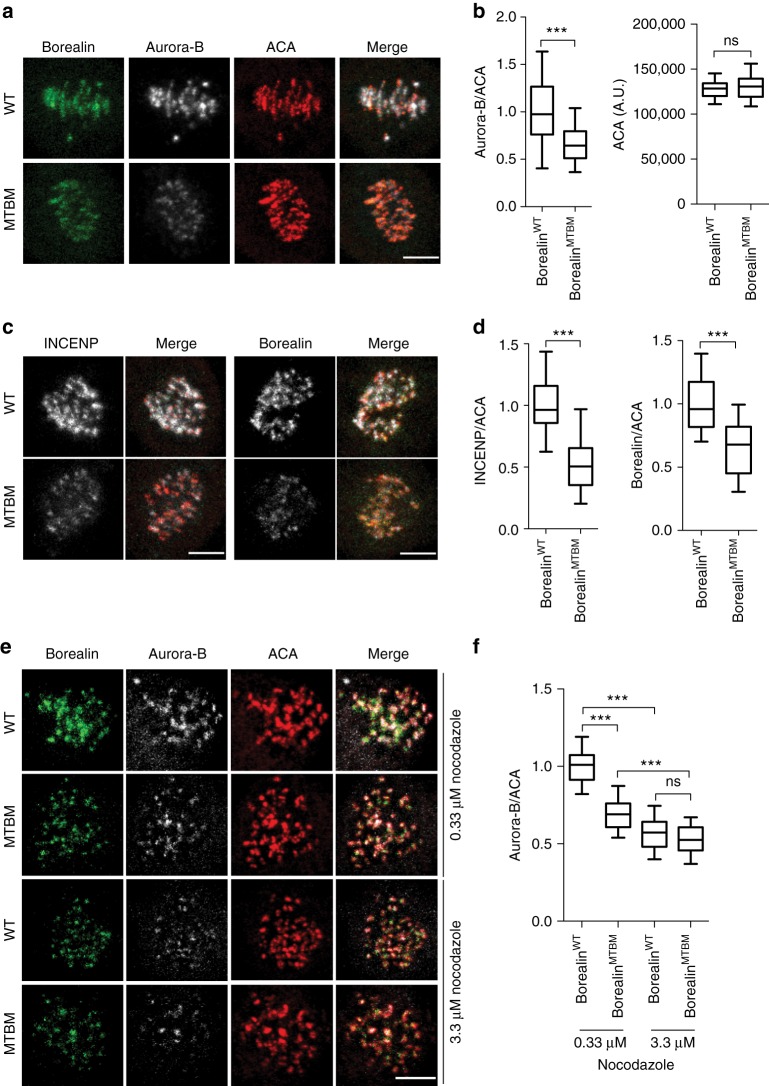
Fig. 6.
Borealin-microtubule interaction drives microtubule-dependent enhancement of the CPC localization to the inner-centromere. HeLa-TReX cells expressing LAP-BorealinWT or MTBM were treated with siRNA as described in Fig. 2a, and immunostained with ACA and Aurora-B (a) or Borealin (c) or INCENP (c) antibodies. b Box and whisker plots of Aurora-B intensity normalized to ACA (P < 0.0001) and absolute ACA intensity (P=0.1396), Unpaired T-test with Welch's correction was applied (n = 94 for WT and n = 110 for MTBM) (representative images in a and quantitation in b from 9 cells per condition, from one of three independent replicates). d Box and whisker plots of INCENP (P < 0.0001) (n = 84 for WT and n = 110 for MTBM) and Borealin (P < 0.0001) (n = 78 for WT and n = 76 for MTBM) intensity normalized to ACA (representative images in c and quantitation in d from eight cells per condition from one of two independent replicates). Statistical analysis was performed using Mann Whitney Test. e HeLa-TReX cells expressing LAP-BorealinWT or MTBM were treated as described in Fig. 2a, and incubated with either 0.33 μM or 3.3 μM nocodazole for 45 min followed by immunostaining with ACA and Aurora-B. f Box and whisker of Aurora-B intensity normalized to ACA (n = 85 for WT and n = 167 for MTBM in 0.33 nocodazole) (n = 140 for WT and n = 100 for MTBM in 3.3 μM Nocodazole) (representative images in e and quantitation data in f from one of two independent replicates with eight cells analyzed per condition). Statistics performed using Dunn's Multiple Comparison Test, ***P < 0.001; **P < 0.01, *P < 0.05 and ns P > 0.05. All Box and whisker plots represent the median (central line), 25th–75th percentile (bounds of the box) and 5th–95th percentile (whiskers). Scale bar is 5 μm

