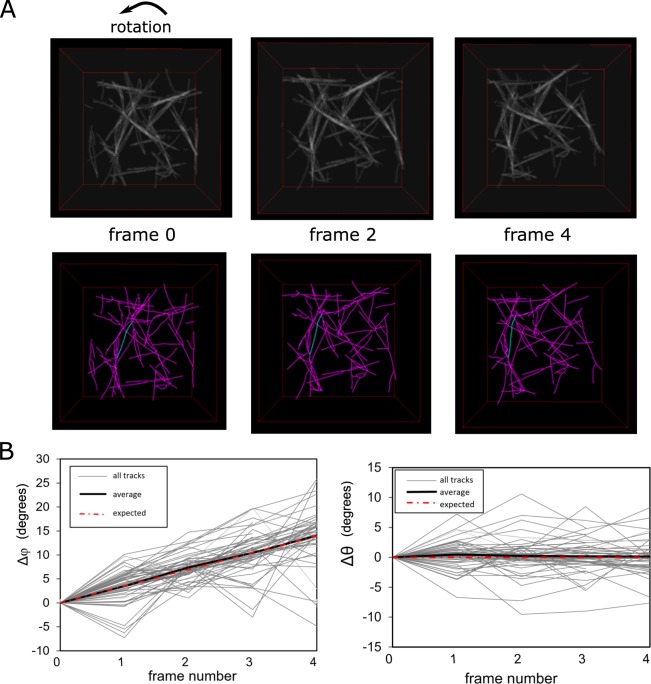
Figure 8.
Tracking uniform rotation of simulated 3D network. (A) Top row: synthetic image (200 pixels/side) generated from filament coordinates in panel A of Fig. 7A (top view). The filaments are rotated by 3.5 degrees along the z axis in a total of four iterations. Bottom row: TSOAX results (with no grouping) with example of tracked segment in blue. (C) Change of azimuthal (ϕ) and polar (θ) angle per frame vs frame number with grouping for 53 snakes presents in more than four frames.

