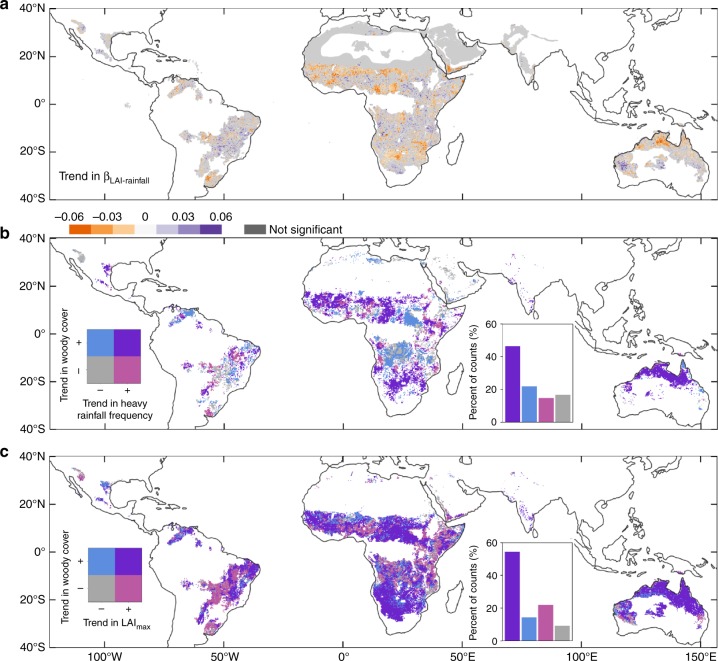
Fig. 3.
Spatial distribution of ecosystem structure changes in tropical savannas. a Significant (p < 0.05) linear trends in βLAI-Rainfall (1982–2015). b Spatial agreement of trends in woody cover (1992–2012) and heavy rainfall frequency (1982–2015). Purple areas show increased trends in both heavy rainfall frequency and woody cover, light red areas show an increase in heavy rainfall frequency, but a decrease in woody cover, blue areas show an increase in woody cover but a decrease in heavy rainfall frequency, and grey areas show a decrease in both woody cover and heavy rainfall frequency. The bar plot shows the percent of count for each group with the same colour scheme as the map (total number of pixels = 17,717). c Spatial agreement of trends in woody cover (1992–2012) and LAImax (1982–2015). Purple areas show increased trends in both woody cover and LAImax, light red areas show a decrease in woody cover and increase in LAImax, blue areas an increase in woody cover and decrease in LAImax and grey areas show a decrease in both variables

