Fig. 2.
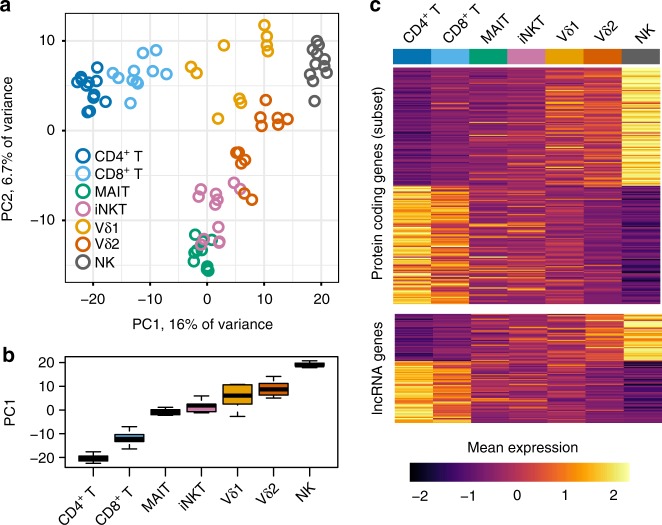
Transcriptomic profiling of ITC reveals a continuous innateness gradient. a PCA performed on the top 1022 most variable (s.d. > 1.4) expressed genes. Plotted are scores for PC1 and PC2. b Distribution of PC1 scores by cell type. c Heatplot of mean expression by cell type for genes associated with innateness gradient. The upper panel shows top 100 positive and negative significant associations within protein-coding genes. The lower panel shows significant associations for 92 lncRNA genes. Genes within each heatplot were sorted by β. Gene expression level was scaled by row. N = 6 donors, 1–2 replicates per cell type. Boxplots are described in Methods

