Fig. 3.
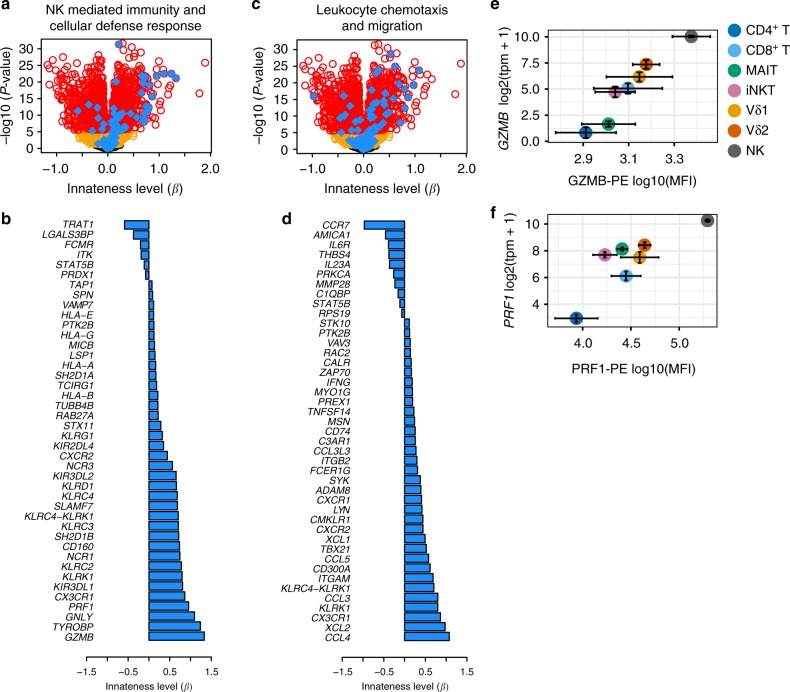
Genes and pathways associated with innateness. a Volcano plot showing associations with the innateness gradient. Yellow, genes with P < 0.05; red, genes with P < 2.5e–06 (Bonferroni threshold); blue, genes with GO terms involving NK-mediated immunity and cellular defense response (GO:0006968, GO:0002228). b Innateness level (β) for individual genes in a with P < 2.5e–06. c As in a but with blue showing genes from GO terms involving leukocyte chemotaxis and migration (GO:2000501, GO:0035747, GO:1901623, GO:0030595, GO:2000401, GO:0097530, GO:0097529, GO:0048247, GO:0072676, GO:1990266). d Innateness level (β) for individual genes in c with P < 2.5e–06. e GZMB and f PRF1 flow-cytometric validation, showing protein levels (x-axis), and transcript levels with RNA-seq (y-axis)

