Fig. 4.
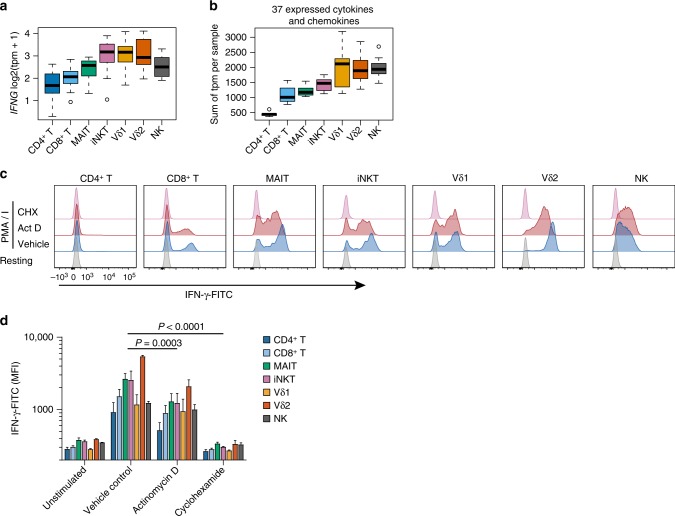
Cytokine and chemokine mRNA in ITC. a Distribution of IFNG transcript levels across all samples. b Sum of expression levels (tpm) for 37 cytokine and chemokine genes across all samples, per cell type. tpm, N = 6; Boxplots are described in Methods. Histogram overlays are normalized to mode. c Representative flow cytometry plots for IFN-γ intracellular staining 2 h after activation in the presence of cyclohexamide to block transcription or actinomycin D to block translation. d As in c, with MFI shown for N = 3, error is s.e.m., P-value is paired t test

