Fig. 5.
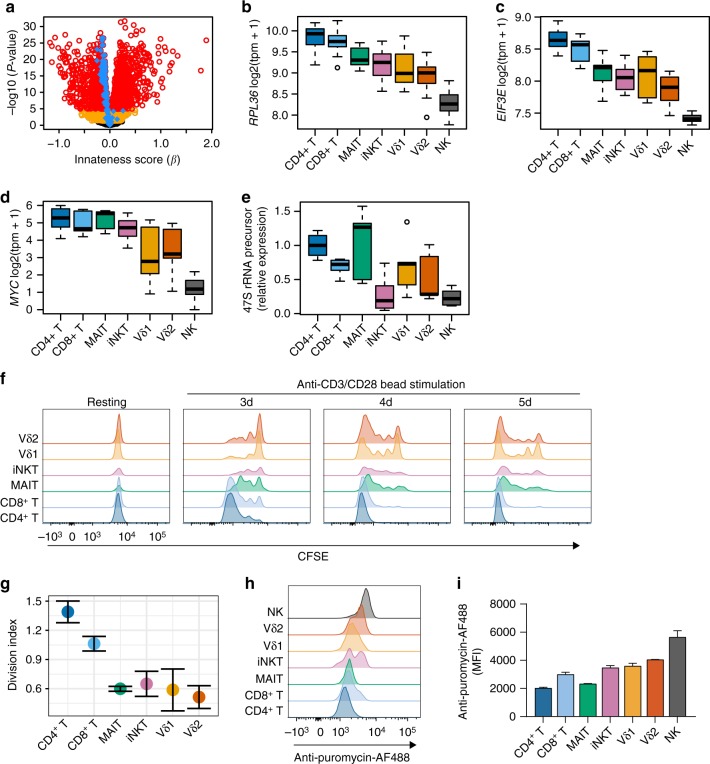
Reduced ribosome transcripts and proliferation in ITC. a Volcano plot showing results of associations with the innateness gradient. Yellow, genes with P < 0.05; red, genes with P < 2.5e–06 (Bonferroni threshold); blue, GO term cytosolic ribosome (GO:0022626). Distribution by cell type for transcript levels of b ribosomal protein RPL36, c translation initiation factor EIF3E, and d MYC (N=6). e qPCR for 47 S rRNA precursor from sorted cell populations (N = 3). Expression shown is relative to HPRT, and normalized to CD4+ T cells for comparison between samples. f PBMCs were labeled with CFSE and then cultured with anti-CD3/CD28-coated beads before staining with markers to identify ITC populations, g division index shown at day 3 (N = 3, s.e.m.). Ribopuromycylation in PBMCs to quantify total translational activity measured by flow cytometry, h representative plot, and i N = 3, s.e.m. Boxplots are described in Methods. Histogram overlays (g, h) are normalized to mode

