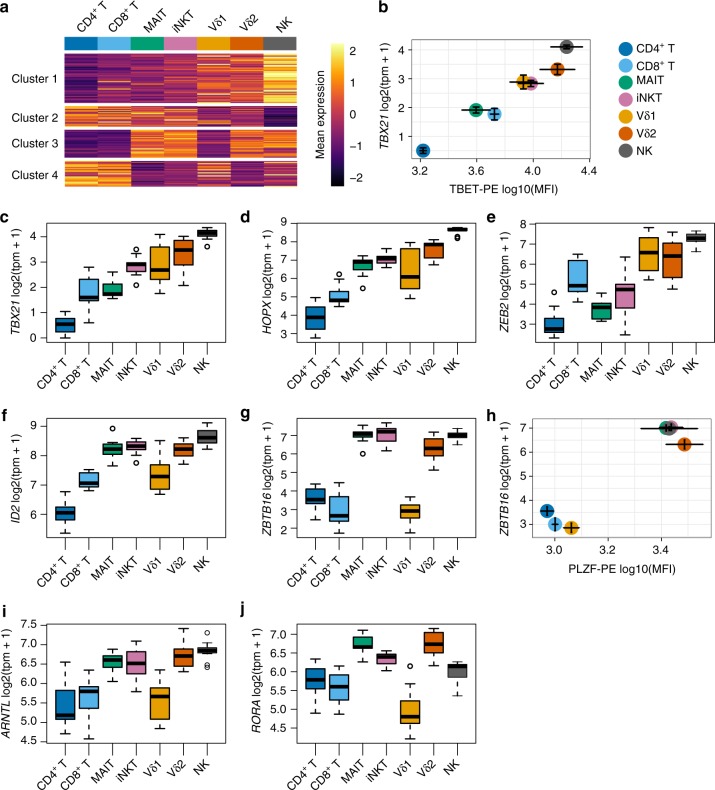
Fig. 6.
Transcription factors in ITC. a Heatmap showing mean expression levels (scaled by row) for variable transcription factors among cell types, clustered into four groups. b Flow-cytometric quantification of T-bet (N = 3) compared to transcript levels with RNA-seq for its encoding gene TBX21 (N = 6). Cluster 1, c TBX21, d HOPX, and e ZEB2; Cluster 3, f ID2, g ZBTB16, i ARNTL, and j RORA. h Flow-cytometric quantification of PLZF (N = 3) compared to transcript levels for its encoding gene ZBTB16 (N = 6). Error for tpm vs. MFI is s.e.m. Boxplots are described in Methods

