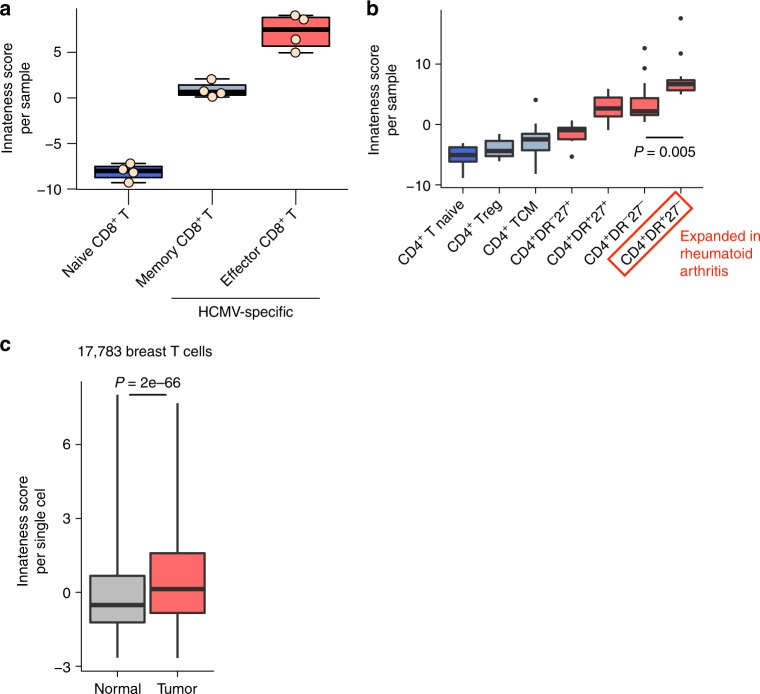
Fig. 7.
Innateness in adaptive T-cell populations. Analysis of innateness score (based on PC1 loadings) for transcriptomic datasets from a HCMV-specific CD8+ T-cell populations (naive = CD45RA+CD27bright; memory = CD45RA–CD27+; effector = CD45RA+CD27–), and b CD4+ T-cell populations from patients with rheumatoid arthritis or osteoarthritis (TCM = T central memory; red boxplots indicate effector subsets). Boxplots are described in Methods. c Single-cell RNA-seq imputed expression data from T cells from normal or tumor breast tissue with innateness score calculated for each cell. Boxes show the first to third quartile with median, whiskers encompass 95% of the data. a N = 4 replicates, b N = 7 rheumatoid arthritis and 6 osteoarthritis donors, c N = 17,783 breast T cells from eight cancer patients. P-values are Wilcoxon test

