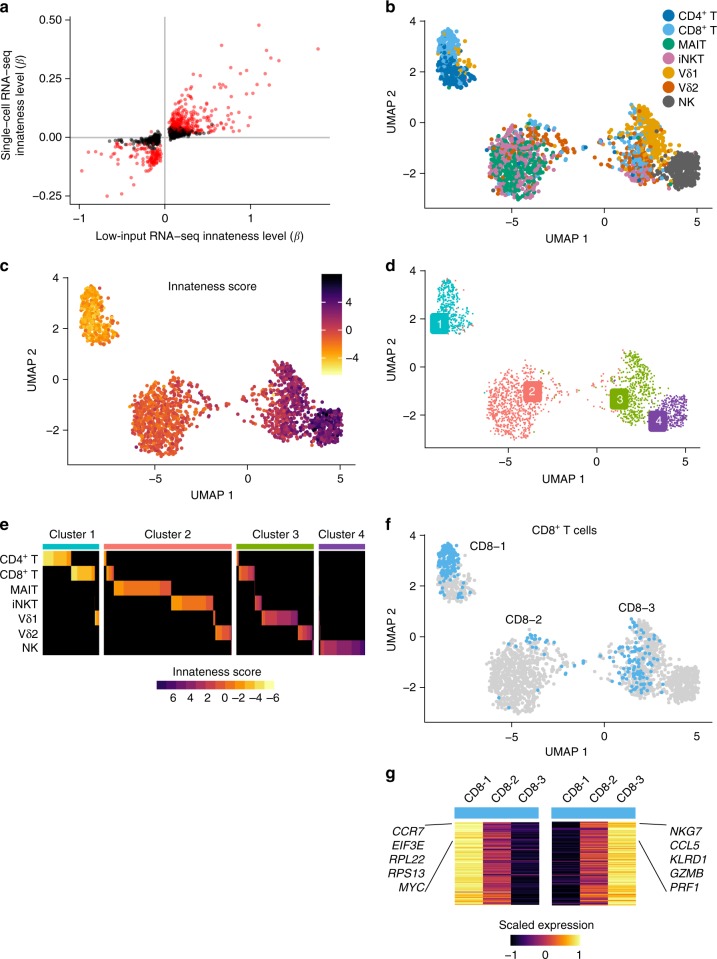
Fig. 8.
Single-cell RNA-seq of ITC. In total, 2306 lymphocytes sorted and barcoded with antibodies to confirm population identity. a Level of innateness (β) in low-input RNA-seq vs. single-cell RNA-seq for genes that were significantly associated with innateness gradient in low-input RNA-seq. In red, genes that were also significant in single-cell RNA-seq (Bonferroni threshold). b UMAP colored by cell type as identified with hashing antibodies, or c innateness score calculated for each cell, or d by the four clusters identified. e Heatplot showing cells colored by innateness score, separated by cell type as identified by hashing antibodies (rows), and sorted by the cluster and innateness score. f UMAP showing CD8+ T-cell subpopulations in clusters 1, 2, and 3. g Left panel, genes upregulated in CD8-1 vs. CD8-2 and CD8-3; right panel, genes upregulated in CD8-3 vs. CD8-1 and CD8-2. Heatmap shows mean expression levels (scaled by row). N = 2 donors per sorted cell population

