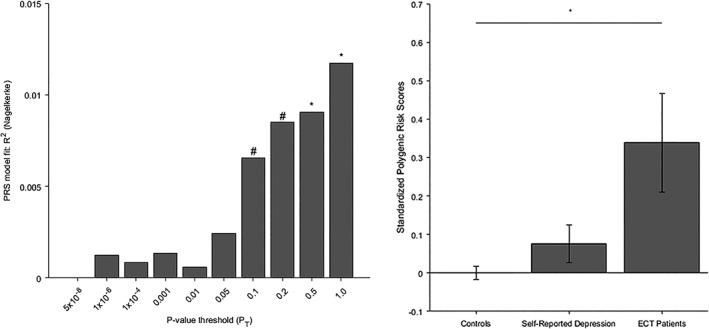
Figure 1.

(a) Model fit for case–control status of MD‐PRS calculated at different p‐value thresholds. *p < .05, #p < .10. (b) Standardized polygenic risk scores in: healthy controls (left, n = 172); individuals with self‐reported depression, (middle, n = 376); ECT patients (right, n = 44). Error bars denote standard error of mean
