
Fig. 4. RNAseq analysis of transcriptional effects of free celastrol and Cel-MC treatment of LPS-stimulated RAW 264.7 cells.
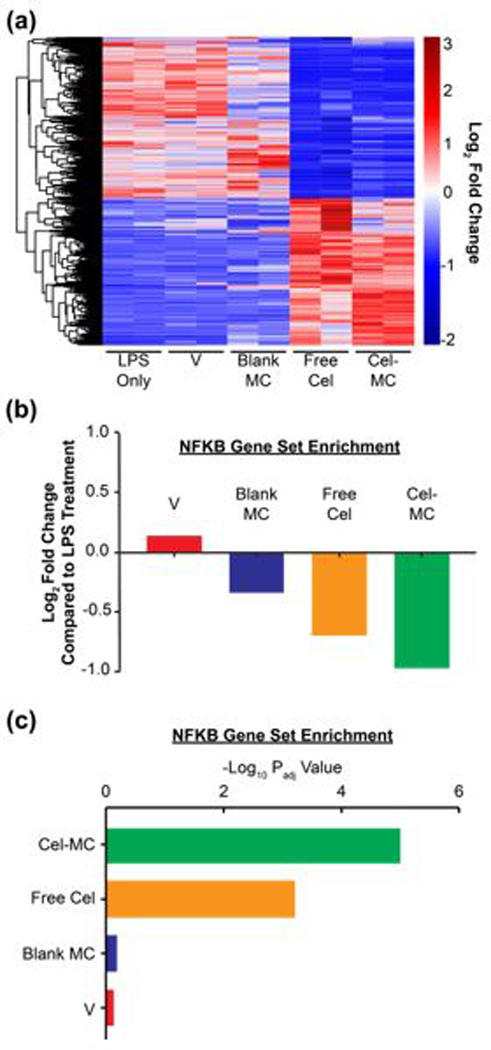
Free celastrol and Cel-MC have similar anti-inflammatory effects on the transcriptomes of LPS-treated RAW 264.7 cells. (a) Heatmap analysis of genes significantly affected by free celastrol. DE-Seq2 analysis identified 2649 genes significantly altered by free celastrol treatment of LPS-treated RAW 264.7 cells after 2 hours. Adjusted P-value (Padj)<0.1. This gene set was used to generate a heatmap with the following conditions: LPS-treated RAW 264.7 cells (LPS), LPS + celastrol vehicle (V), LPS + blank micelles (Blank MC), LPS + free celastrol (Free Cel), and LPS + Cel-MC (Cel-MC). Red and blue colors respectively represent genes that are overexpressed and underexpressed in that sample compared to the other cohorts. (b) Fold Change and (c) Padj of the NF-κB gene set. Gene set variation analysis of the NF-κB pathway (Hinata NF-κB Matrix Gene Set) in LPS-treated RAW 264.7 cells treated for 2 hours with vehicle (V), blank MC, free celastrol, or Cel-MC. Fold change is relative to RAW 264.7 cells treated with only LPS.