
Fig. 5. Flow cytometric analysis of changes in cell populations in ldlr−/− mice treated with free celastrol or Cel-MC.
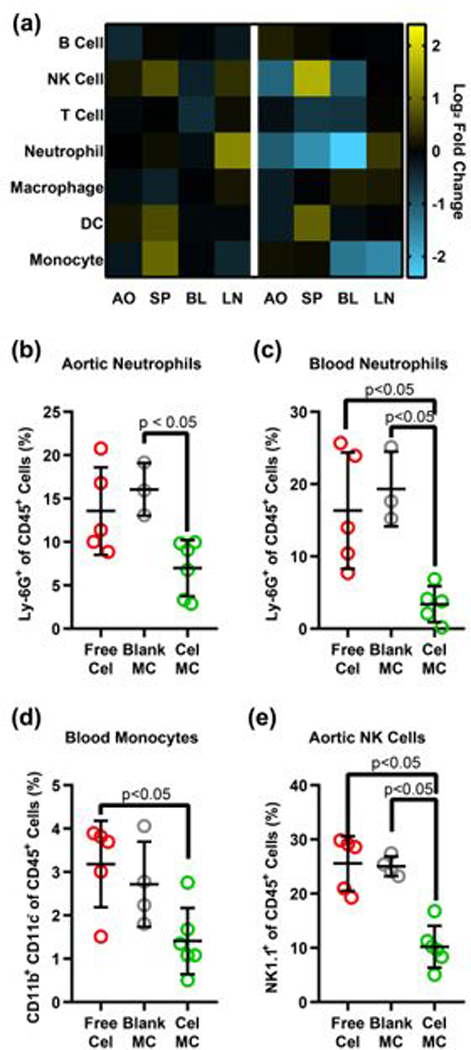
(a) Heatmap of fold change in cell populations. Each row represents an immune cell population, each column represents the organ from which the cells were isolated. Heatmap is on a log2 scale, with yellow representing a fold increase and blue representing a fold decrease in that cell population, compared to the Blank MC control. Cell population as a percent of all immune cells for a given population in a given organ are also provided for: (b) aortic neutrophils, (c) aortic NK cells, (d) blood monocytes, and (e) blood neutrophils. All significant p-values are displayed on their graphs, calculated using Dunn’s multiple comparisons test. Cells were identified as follows: B cells – CD45+ CD19+, NK cells – CD45+ NK1.1+, T cells – CD45+ CD3+, Neutrophils – CD45+ Ly-6G+, Macrophages – CD45+ CD3- NK1.1- CD19- Ly-6G- F4/80+, Dendritic cells – CD45+ CD3- NK1.1- CD19- Ly-6G- F4/80- CD11c+, Monocytes – CD45+ CD3- NK1.1- CD19- Ly-6G- F4/80- CD11c- CD11b+ Ly-6C+.