
Figure 5: NRL is required for the photoreceptor program in Group 3 MB.
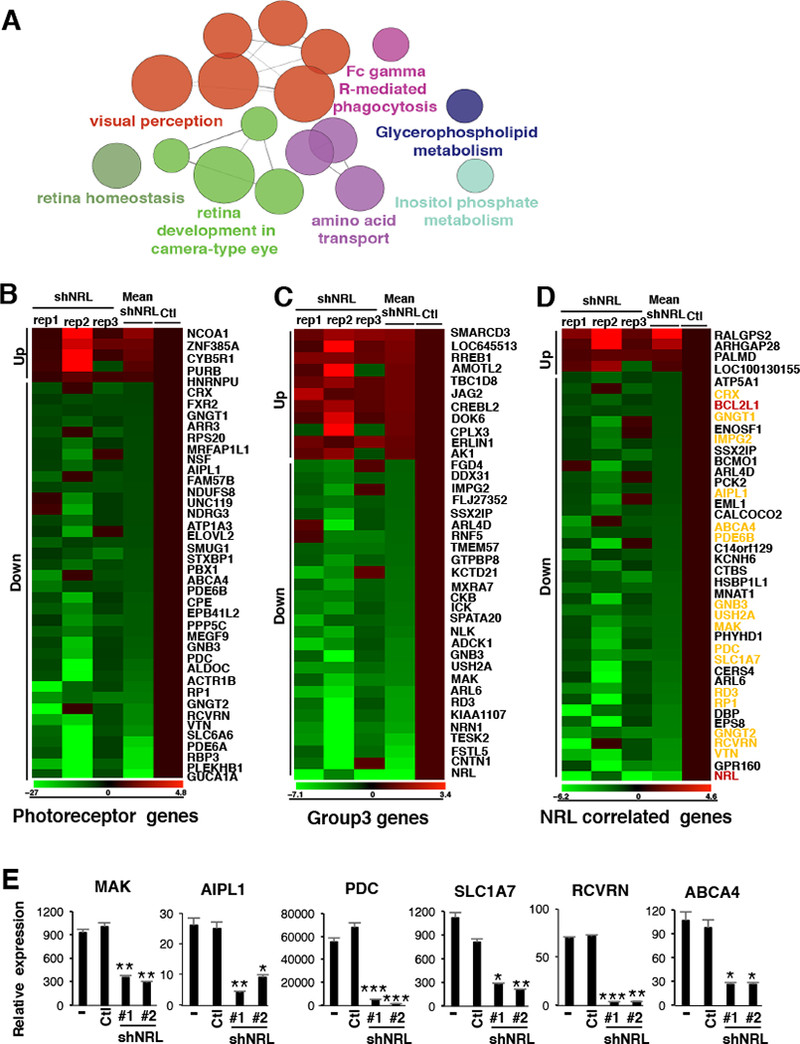
Transcriptional profiling was performed on D458MED cells following shRNA-mediated NRL knockdown. (A) KEGG pathways enriched in differentially expressed genes following NRL knockdown in D458MED. Nodes represent enriched gene sets and are sized proportional to significance. (B-D) Expression heatmap visualization of genes significantly altered in the context of NRL knockdown and representing known photoreceptor genes (B) (see the complete list in Table S4, (McEvoy et al., 2011)), Group 3 signature genes (C) (see the complete list in Table S5, (Kool et al., 2008)), or genes highly correlated (correlation score≥0.6) with NRL expression in human MB samples (D) (see the complete list in Table S6). In D, photoreceptor genes are highlighted in yellow and the candidate of interest, BCL2L1, in red. The relative expression obtained in the individual triplicate (shNRL rep1–3) knockdowns as well as the mean expression fold-change (mean shNRL knockdown relative to control cells (Ctl)) are shown (B-D). (E) RT-qPCR validation confirming the downregulation of a subset of photoreceptor genes following NRL knockdown (shNRL#1 and #2) in D458MED cells. Bars represent the mean ± SD. The p value was determined by unpaired t test. * p-value < 0.01, **p-value < 0.001, ***p-value<0.0001. See also Table S3 to S6.