
Figure 6: BCL-XL is a transcriptional target of NRL in Group 3 MB.
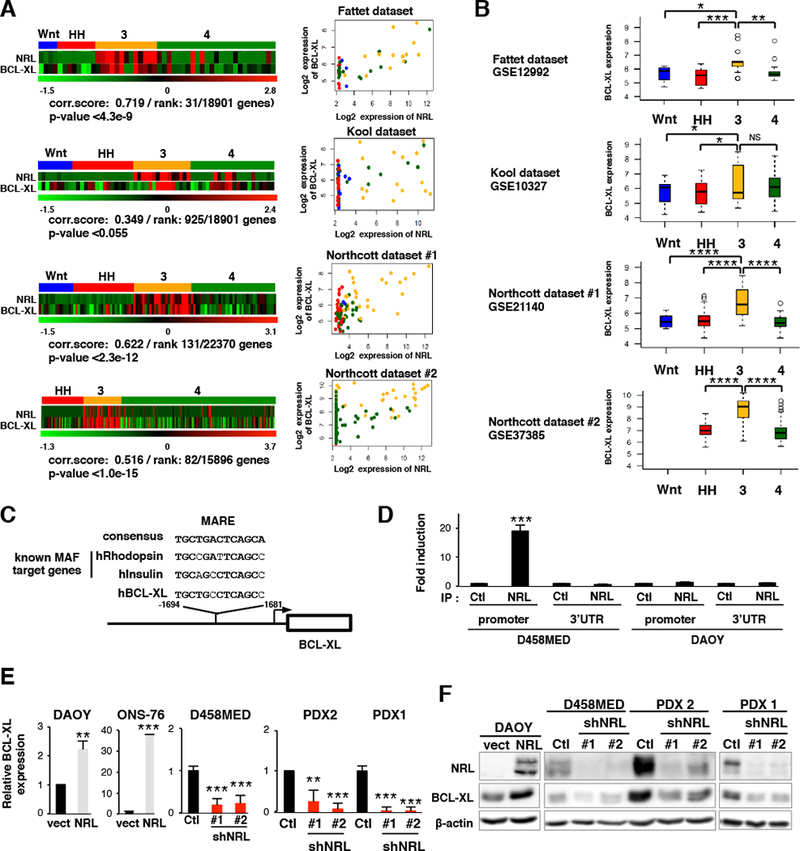
(A) Left, Heatmaps showing the expression of NRL and BCL-XL across MB subgroups in multiple published datasets: Fattet dataset, GSE12992 (Fattet et al., 2009), Kool dataset, GSE10327 (Kool et al., 2008), Northcott#1 dataset, GSE21140 (Northcott et al., 2011) and Northcott#2 dataset, GSE37385 (Northcott et al., 2012b). Pearson correlation scores (NRL expression versus BCL-XL expression) are indicated, as is the correlation rank of BCL-XL versus all other measured genes and the associated p-values. Right, Scatter plots summarizing the expression correlation between NRL and BCL-XL. MB subgroups are indicated by color: WNT (blue), SHH (red), Group 3 (yellow) and Group 4 (green). (B) Boxplots depicting the log2 expression of BCL-XL (BCL2L1) across MB subgroups for each of the published datasets summarized in (A). Boxplot center line shows data median, box limits indicate 25th and 75th percentiles, lower and upper whiskers represent 1.5x the interquartile ranges respectively. Outliers are represented by individual dots. (C) A potential MARE (Maf-Responsive-Element) in the human BCL-XL promoter is depicted. The sequence is compared to the MARE consensus sequence and to MAREs of established MAF target genes. (D) ChIP analysis of two different regions of the BCL-XL locus, the MARE-containing region of the promoter and the 3’ UTR (negative control). qPCR results for anti-NRL ChIP (IP NRL) or a control ChIP (IP Ctl) in D458MED and, as a negative control, in NRL non-expressing DAOY cells are shown. (E-F) Expression level of BCL-XL assessed by RT-qPCR (E) or immunoblot (F) in MB cell lines and PDX models in the context of exogenous NRL expression or NRL knockdown as indicated. The level of BCL-XL mRNA was set at 1 for controls. Bars represent the mean ± SD. The p value was determined by unpaired t test. *p-value <= 0.5, **p-value<0.05, ***p-value<0.005, ****p-value<0.0005.