
Figure 8: The BCL inhibitor TW37 attenuates MB growth in vitro and in vivo.
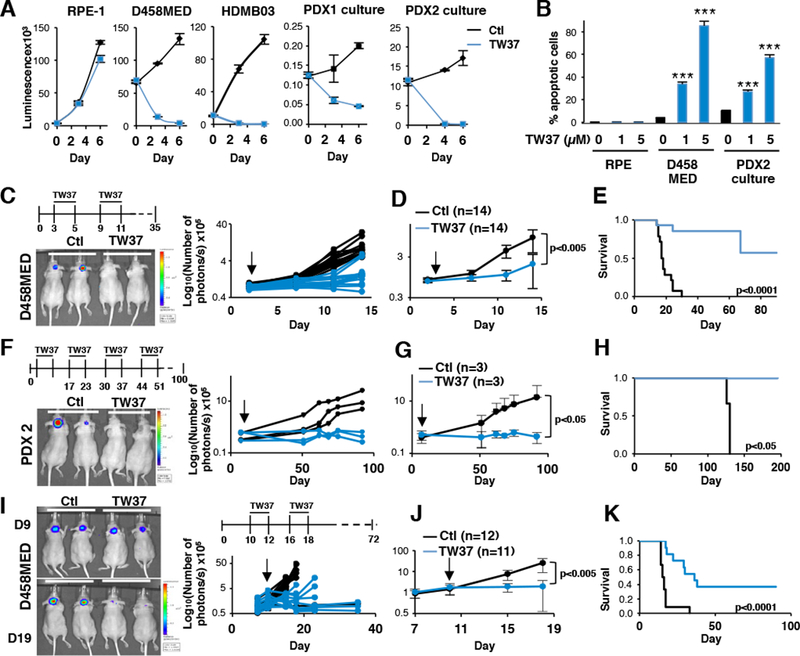
The effect of TW37 (shown in blue) was compared to vehicle (shown in black) on different models in vitro and in vivo. (A) Cell viability was measured in vitro by luminescence using Cell titer Glo assay in control or in TW37 treated cells as indicated (RPE-1: non-cancerous hTERT-immortalized cell line). Cells were treated every 2 days with 5μM of TW37. (B) Apoptosis was assessed by measuring cleaved caspase 3 levels by FACS 48hrs after seeding in control conditions or upon TW37 treatment (1 and 5μM). D458MED (n=14 for each group) (C-E) and PDX2 (n=3 for each group). The p value was determined by unpaired t test. (F-H) cells stably expressing luciferase were orthotopically engrafted into the cerebellum of nude mice. Intravenous injection of TW37 (30mg/kg) or vehicle was started 2 days later. Protocols of treatment are indicated (top of panels C and F). Tumor growth was assessed by bioluminescence using IVIS imaging. (C and F, left panels) An image of luciferase signal obtained from representative mice is shown. (C and F right panels) Quantification of the bioluminescence signal for each individual mouse and (D and G) its average for each group. p values were determined by the sum-of-squares F test. (E and H) Kaplan Meier survival curves. (I-K) The effect of TW37 treatment was assessed on established tumors upon orthotopic engrafting of luciferase expressing D458MED cells. Mice were left untreated for 9 days until tumor growth was established (luciferase signal of ~105 photons/s). Mice were treated twice during 3 days (n=12 for the vehicle (Ctl) vs n=11 for TW37 at 30mg/kg) as indicated (panel I top, treatment protocol is depicted). (I, right panel) Tumor growth was estimated by bioluminescence quantification for each individual mouse or (J) an average of the signal was calculated for each group. (I, left panel) Representative image of the bioluminescence signal observed at the start of treatment (day 9) and just after the last treatment (day 19). (K) Kaplan Meier survival curves for each group. The p value for survival was determined by log-rank (Mantel-Cox) test for each Kaplan Meier survival curves. ***p-value<0.0001. Bars represent the mean ± SD. See also Figure S7.