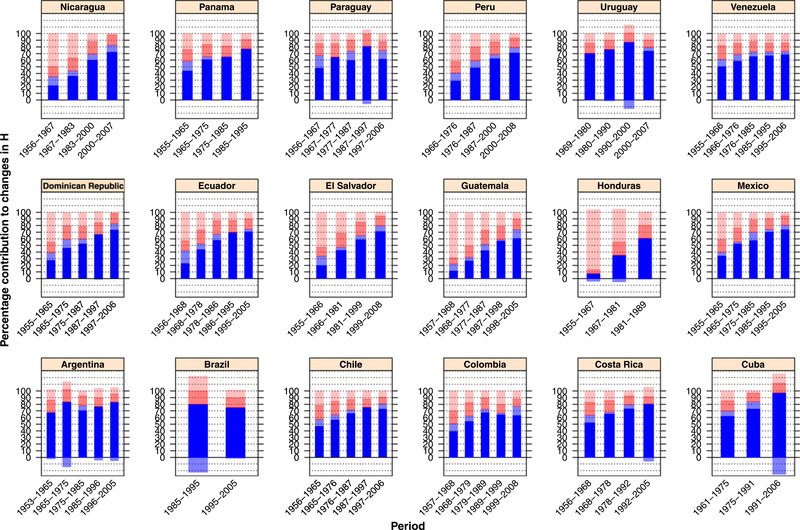
Fig. 6.
Contribution of changes in premature (blue for e† and pink for e0) and older (light blue for e† and light pink for e0) deaths to changes in female life table entropy by country and period. Negative values in older e† (light blue) indicate that there was an increase over the period in average years of life lost due to death at older ages. Source: Authors’ calculations using data from LAMBdA (Palloni et al., 2014) and Eqs. (3.1)-(3.5). (For interpretation of the references to color in this figure legend, the reader is referred to the web version of this article.)

