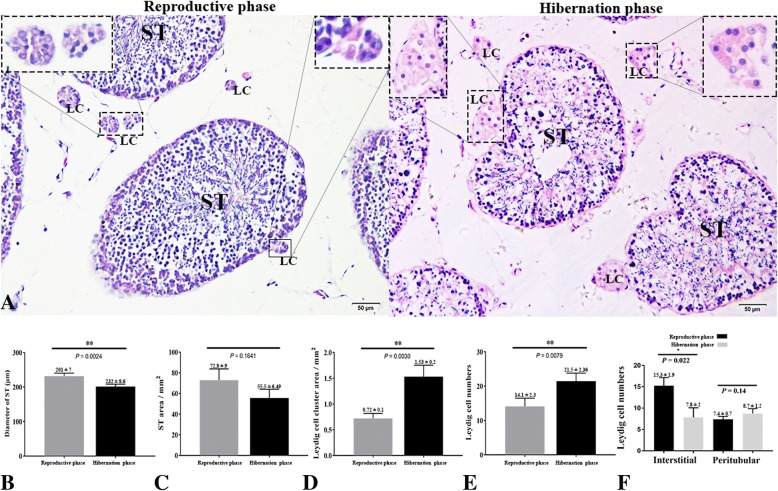
Fig. 1.
Testis histology during reproductive activity and hibernation. A higher magnification is illustrated in the rectangular area. Quantification of the (b), diameter of ST (P = 0.0024) (c), ST areas (P = 0.1641) (d), Leydig cell cluster area (P = 0.0030) (e), Leydig cell numbers (P = 0.0079) (f) and Leydig cell number at the peritubular (P = 0.14) and interstitium (P = 0.022) (n = 18 per group). ST: Seminiferous tubule; L: Leydig cell. Scale bar = 20 μm (a). Data presented as Mean ± SEM

