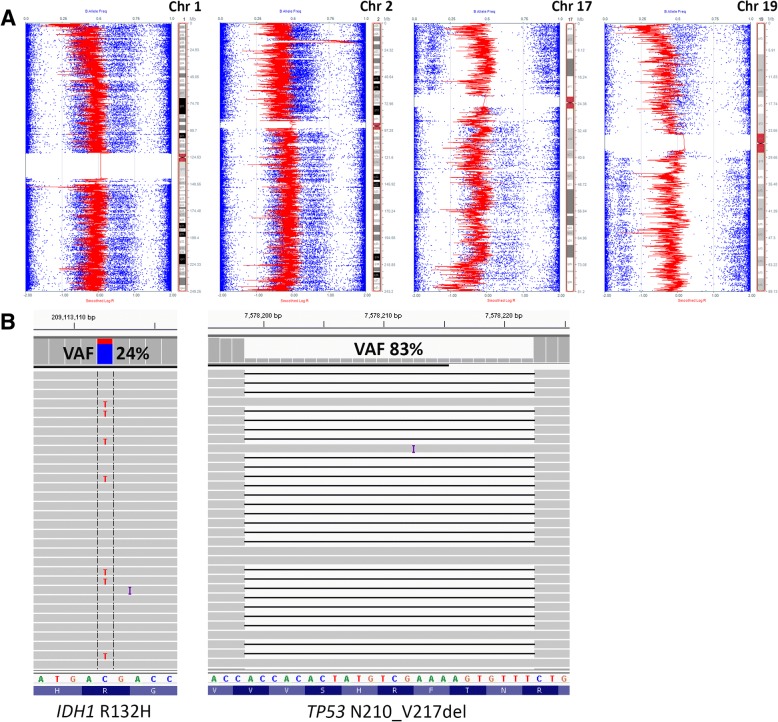
Fig. 3.
Single nucleotide polymorphism (SNP) array data using Illumina HumanCytoSNP-850 K (v1.1) BeadChip platform (approximately 850,000 SNPs) and iScan microarray system and illustrated with KaryoStudio v2.0 software; red data show smoothed signal intensity values (LRR) (Log base 2 ratio of observed and expected intensities; LogR 0, copy number two) and blue data points represent the B-allele frequency (BAF) of each individual SNP (B-allele frequency of 0 equals no B-allele; 1 equals only B-alleles present). Loss of chromosomal segments is supported by the downward shift of the red vertical line (decrease in LRR, left shift) and loss of heterozygosity (LOH) in BAF (loss of heterozygous BAF track around 0.5 with variable redistribution of BAF in in region of LOH associated with the ratio of tumor to normal DNA in the sample), while gains/amplifications of genomic regions show upward shifts of the red vertical line (increase in LRR, right shift) and LOH in BAF. Loss of whole chromosome 1, 2q, 17p, and the majority of 17q and 19q is depicted here (a) as well as gain/amplification of 2p24.2-p24.3, which includes MYCN. Initial amplicon-based targeted next generation sequencing using the Ion AmpliSeq Cancer Hotspot Panel v2 demonstrated an IDH1 hotspot mutation (p.R132H) and an in-frame TP53 deletion (p.N210_V217del), visualized here using Integrated Genomics Viewer v2.3.4 (IGV; Broad Institute, MIT Harvard) (b). Subsequent SNP array analysis demonstrated loss of whole arm 17p (TP53 is located at 17p13.1) in the vast majority of the sample; therefore, the TP53 VAF can be used to approximate tumor purity. The IDH1 mutation, on the other hand, appears to be present in only a fraction of tumor cells, while IDH1 wild type cells comprise the remainder of the tumor with apparent loss of the mutant IDH1 allele (IDH1 is located at 2q34). Matched normal (tissue or peripheral blood) was not available for comparison

