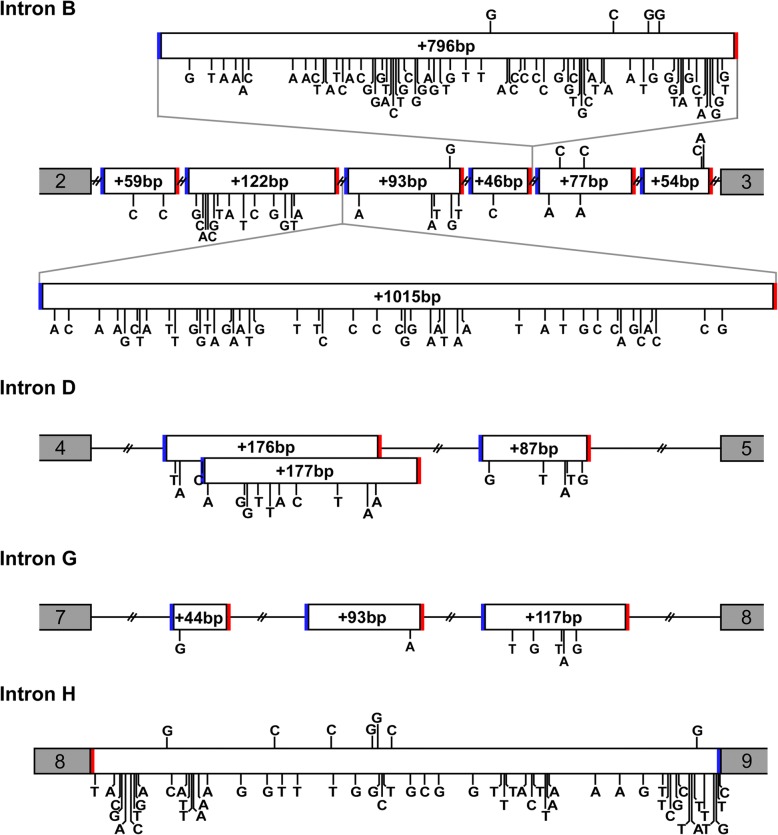
Fig. 4.
Polymorphisms in new exon sequences. Diagram shows relative positions of retained intron sequences that were found during the hGR screening which includes 14 new exons and intron H. Variations from the reference hGR intron sequence, indicated by a vertical line and substituted nucleotide, are shown above the retained sequence structure if detected in our laboratory’s hGR screening, or below if found in the survey of databases and publications. The two nucleotides immediately before and after the exons are indicated to show the splice acceptor sites (AG; solid blue line) and splice donor sites (GT; solid red line)

