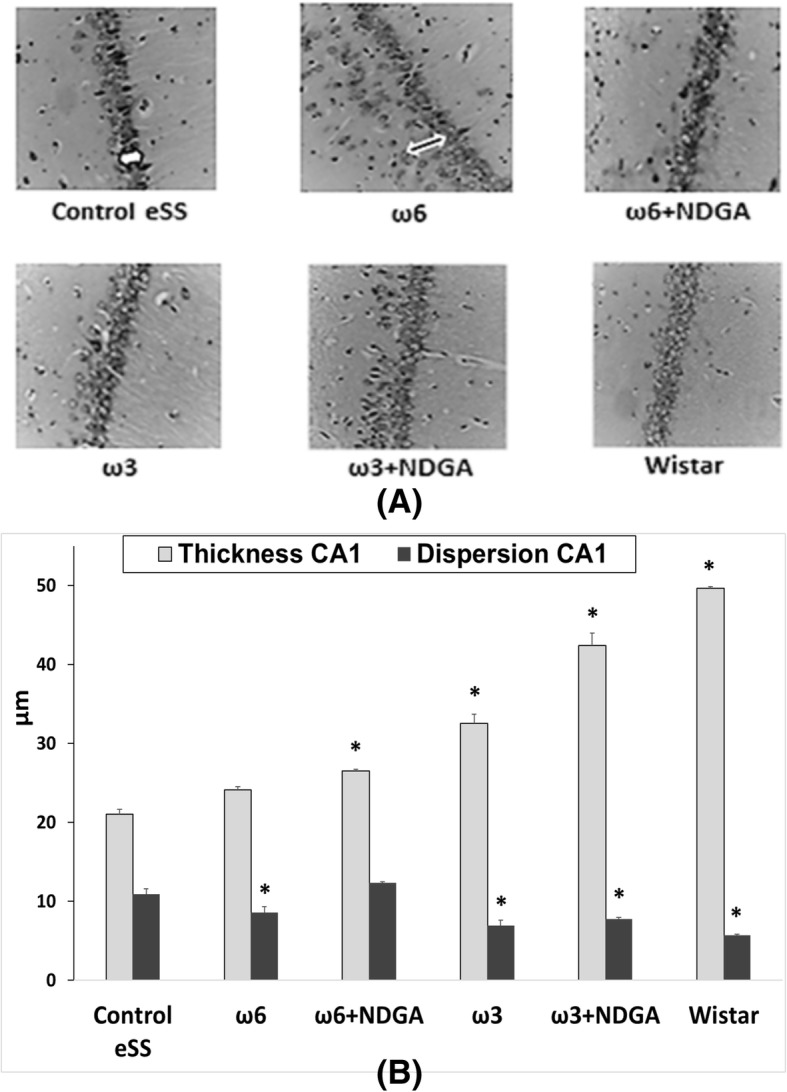
Fig. 4.

Histological sections of hippocampus. a Cell dispersion (black arrow) and thickness (white arrow) of the hippocampal CA1 zone, at 12 months of aging. Nissl 40x. b Histopathological analysis. Data are expressed as mean ± SEM * Indicate significant difference to Control eSS at the end of 12 months, p ≤ 0.05
