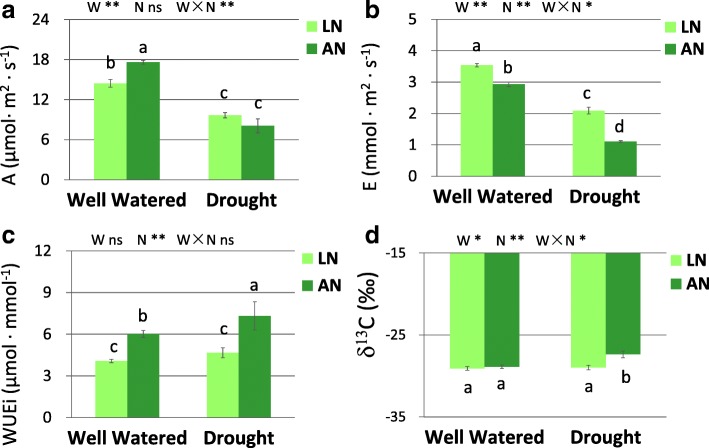
Fig. 3.
Average value of A (a), E (b), WUEi (c) and δ13C (d) in leaves. LN, low nitrogen. AN, adequate nitrogen. A, net photosynthetic rates. E, transpiration rates. WUEi, intrinsic water use efficiency. δ13C, stable carbon isotope compositions. The bars indicate means ± SE (n = 12). Different letters on the bars indicate significant differences (P < 0.05) based on multiple comparisons (Tukey’s HSD test) in ANOVA. P-values of the two-way ANOVA of water (W), nitrogen (N) and their interactions (W × N) are indicated. *P < 0.05; **P < 0.01; ns, not significant

