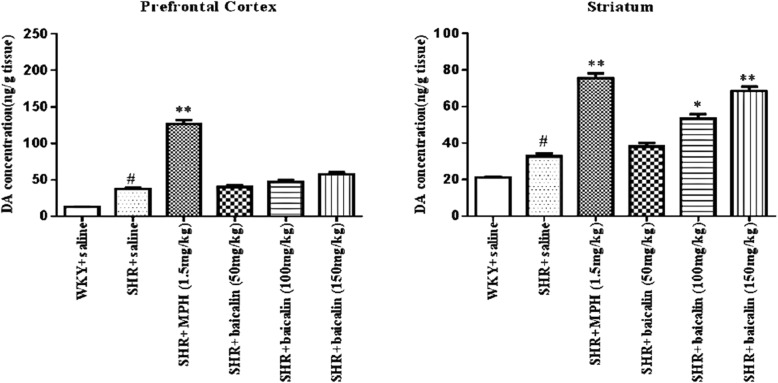
Fig. 7.
DA levels in the PFC and Striatum. Note: Effects of baicalin on the DA levels in the PFC and striatum. A and B represent DA concentration in PFC and striatum. Data are expressed as the mean ± SEM, n = 10. #p < 0.05 and ##p < 0.01 versus WKY + saline group; *p < 0.05 and **p < 0.01 versus SHR + saline group

