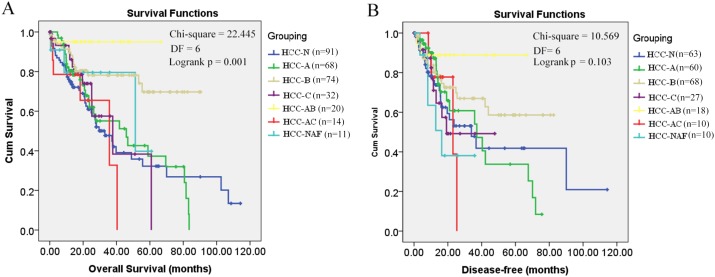
Figure 1. Kaplan–Meier survival analysis of HCC patients in different groups.
(A) Overall survival analysis; (B) Disease-free survival analysis; p < 0.05 was considered to be statistically significant. HCC-N, HCC patients with no risk factor; HCC-A, HCC patients with alcohol consumption only; HCC-B, HCC patients with HBV infection only; HCC-C, HCC patients with HCV infection only; HCC-AB, HCC patients with alcohol consumption and HBV infection; HCC-AC, HCC patients with alcohol consumption and HCV infection; HCC-NAF, HCC patients with non-alcoholic fatty disease. DF, degrees of freedom.

