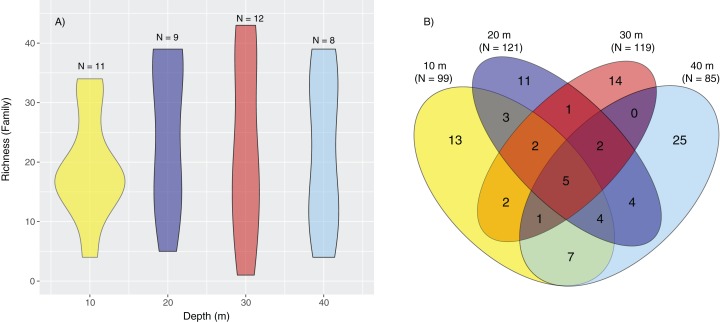
Figure 3. Violin plot representing family richness and Venn diagram representing the number of families identified by depth.
Violin plot representing family richness (A) estimates based on sediment samples collected at two coral reefs in Okinawa, Japan and 18S rRNA sequences. The Venn diagram (B) represents the number of families identified by depth. Yellow, dark blue, red, and light blue segments of the Venn diagram represent the number of families identified at 10, 20, 30, and 40 m, respectively, with shaded colors indicating the shared number of families across different depths.

