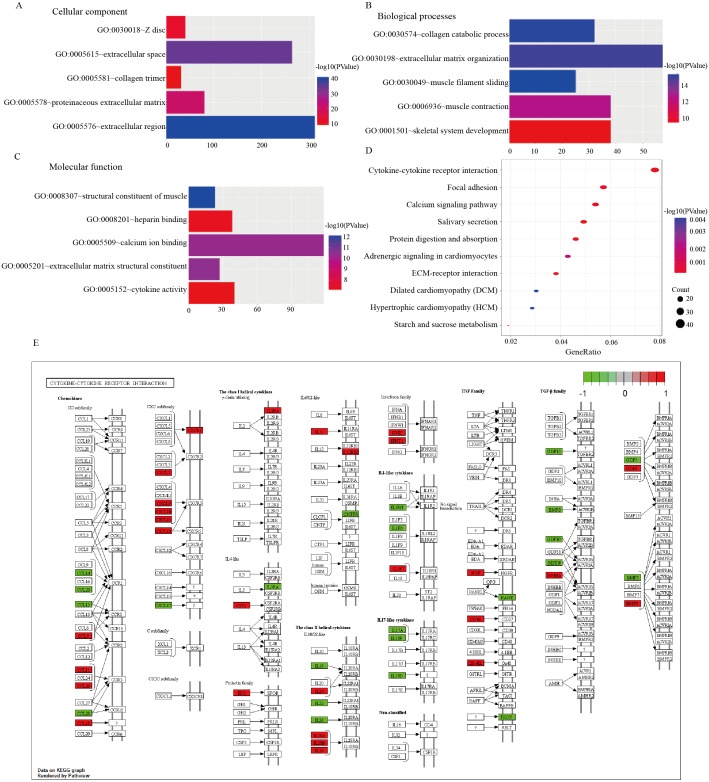
Figure 3. GO and KEGG pathway analyses.
(A) Top five cellular component terms of dysregulated genes in the GO analysis. (B) Top five biological processes terms of dysregulated genes in the GO analysis. (C) Top five molecular function terms of dysregulated genes in the GO analysis. (D) Top10 pathways of dysregulated genes in the pathway analysis. (E) Cytokine-cytokine receptor interaction map from KEGG analysis.

