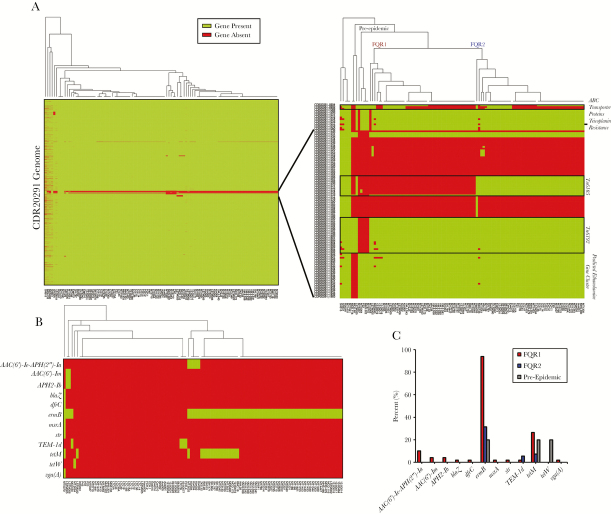
Figure 2.
Gene presence or absence analysis amongst 108 clinical strains. (A) Genes that were covered by sequencing in the R20291 genome for each strain were plotted as green, whereas gene absence is plotted red. Gene absence may have been due to low coverage in some of the strains. A closer view of regions of high variability on the right allows for complete discrimination between FQR1 and FQR2 strains. (B) Antimicrobial resistance genes were found in the genomes of the samples, and (C) overall gene presence is shown for FQR1, FQR2, and the pre-epidemic strains.

