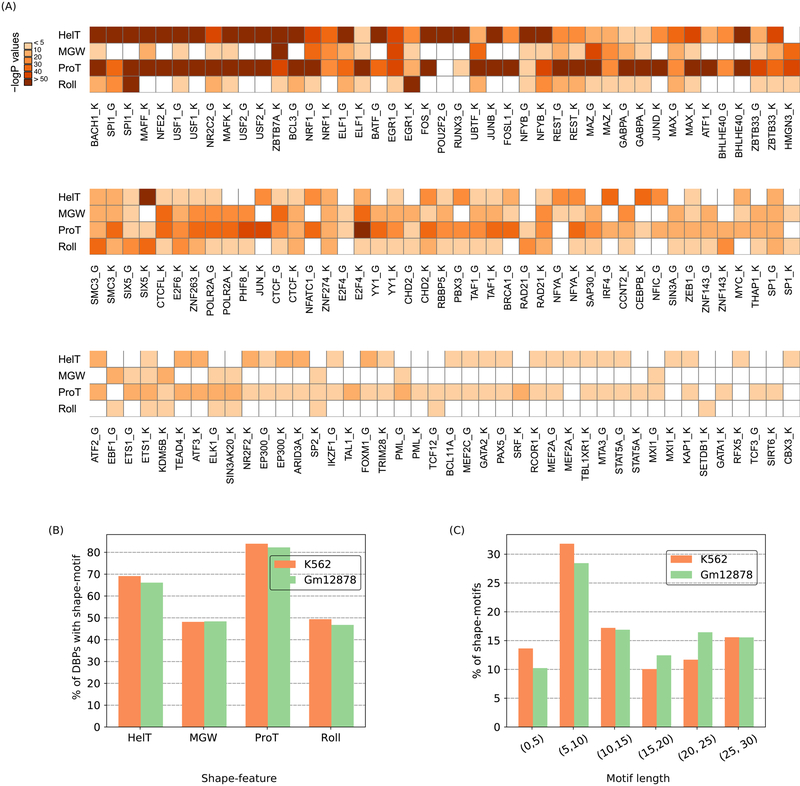
Figure 2.
Most DBPs have shape-motifs. (A) Heatmap of negative-log10 transformed Bonferroni corrected p-values for each type of shape-motif of each DBP. White cells indicate no significant motif. ‘K’ or ‘G’ after a DBP’s name denotes K562 or Gml2878 cells, respectively. (B) Fraction (%) of DBPs with each type of shape-motif. (C) Length distribution of shape-motifs. Orange and green bars in B, C represent data from K562 and Gml2878 cell-lines, respectively.

