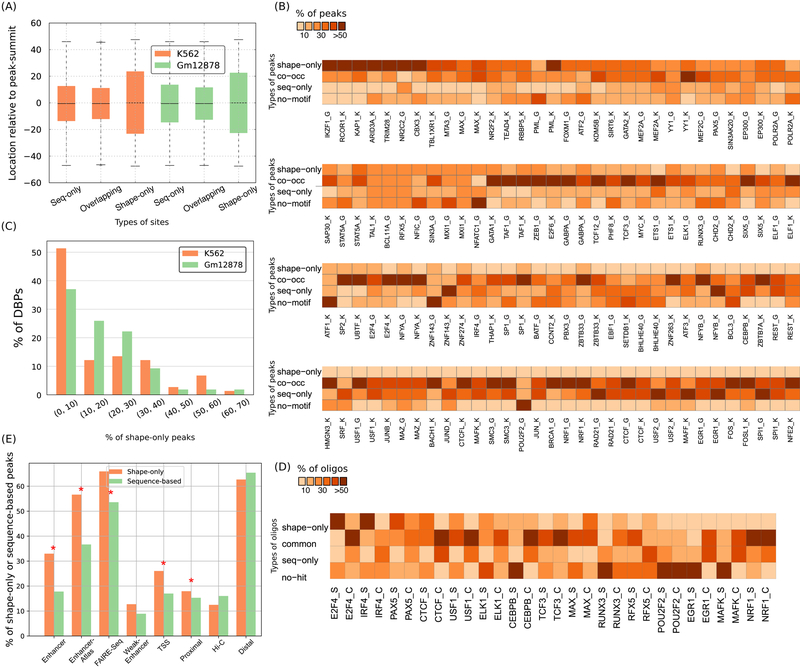
Figure 4.
Prevalence and genomic properties of shape- and sequence-motifs. (A) Sequence-only, shape-only, and overlapping-sites are located at similar distances relative to ChIP-Seq peak-summits. Each box extends from the lower to upper quartile values of the data, with a line at the median. The whiskers extend from the box to show the range of the data. Orange and green boxes represent data from K562 and Gml2878 cell-lines, respectively. (B) Heatmap showing the proportion of shape-only, common, and sequence-only peaks. ‘K’ or ‘G’ after a DBP’s name denotes K562 or Gml2878 cells, respectively. (C) Histogram showing fraction (%) of DBPs binned according to the fraction (%) of their shape-only peaks genome-wide. Orange and green bars represent data from K562 and Gml2878 cell-lines, respectively. (D) Fraction (%) of final-round HT-SELEX oligonucleotides and ChlP-Seq peaks that are shape-only, co-occurrence, and sequence-only. ‘S’ or ‘C’ after a DBP’s name denotes HT-SELEX or ChIP-Seq, respectively. (E) Barplots showing the faction (%) of shape-only peaks and sequence-based (sequence-only plus co-occurrence) peaks in different types of regulatory regions in the K562 cell-line. Shape-only peaks are more enriched in putative enhancer regions than are sequence-based peaks; significant enrichments are marked with stars.

