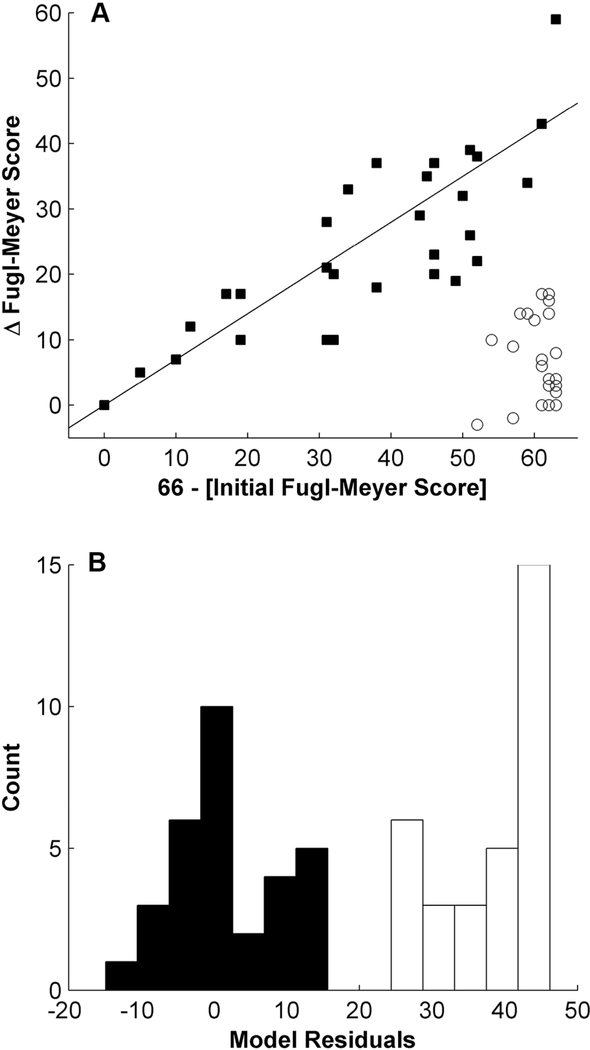
Figure 1. The evolution of motor function after stroke follows one of two strictly different paths.
Hierarchical clustering separated patients into 2 different clusters of recovery. Patients with filled squares recovered a fixed proportion of their initial motor impairment (proportional recovery, PROP), while patients with empty circles showed no or very little improvement (POOR). The straight line represents the proportional recovery model predicting a recovery of 70% of initial impairment (A). A histogram of the deviation from proportional recovery again demonstrates the clear separation into two groups (B).

