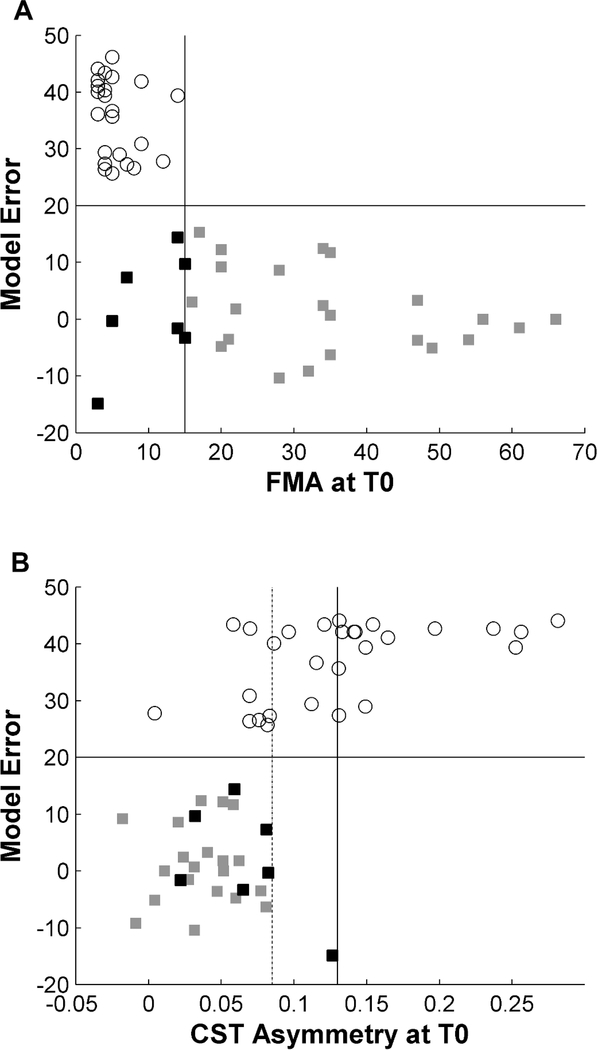
Figure 5. Prediction of proportional vs. poor recovery.
A combination of clinical assessment and DTI of the CST at T0 allowed predicting whether patients will show PROP or POOR with high accuracy in the majority of patients in our sample. All patients with an initial FMA >15 (gray squares) recovered according to the proportional model (A). Among the remaining patients with severe initial impairment, POOR (white circles) was observed in 95% of patients with a CST asymmetry >0.085 (dotted line) and in 100% of patients with CST asymmetry > 0.13 (continuous vertical line). Conversely, 43% of patients with severe initial impairment but low CST damage evolved to PROP (black squares) (B).

