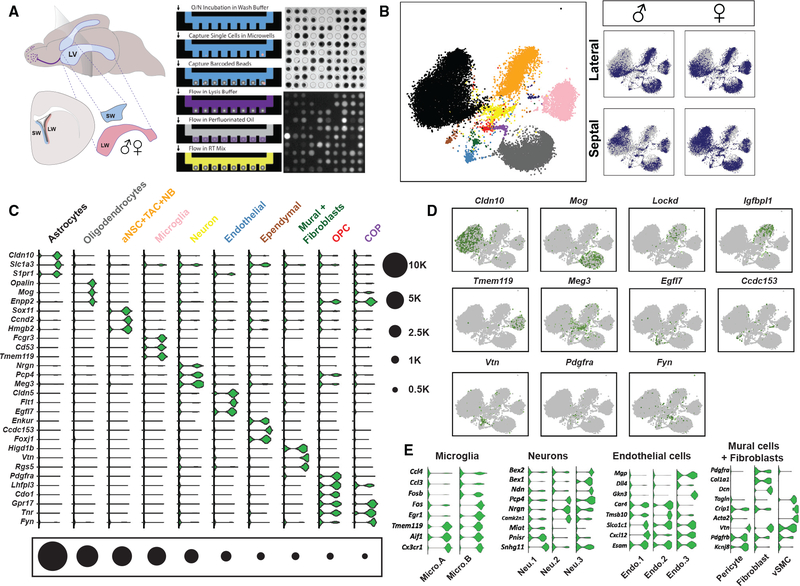
Figure 1. Large-Scale scRNA-Seq Reveals Major Cell Types in the V-SVZ.
(A) (Left) Schema of adult mouse brain showing location of the lateral ventricles (light blue, LV). Plane indicates level of coronal schema (below left) highlighting location of lateral wall V-SVZ (LW, red) adjacent to the striatum and septal wall V-SVZ (SW, blue) adjacent to the septum. Whole mounts of the entire LW (red) and SW (blue) were dissected from adult male and female mice, dissociated to single cells, and loaded onto a microwell-array-based platform. (Right) Workflow of single-cell capture and RT in microwell-array-based platform. Drop-seq beads and calcein-AM-stained V-SVZ cells were imaged to check for lysis efficiency during RNA capture step. (Top right) Bright-field image of cell- and bead-loaded microwells is shown. (Bottom right) Fluorescent image of lysed V-SVZ cells is shown.
(B) t-SNE projections of major cell types. Color-coding corresponds to cell types shown in (C). T cells are midnight blue. (Right) Individual samples are highlighted in blue on the combined dataset background (gray). Note that astrocytes comprise two large astrocyte clusters (Astrocyte A and Astrocyte B), which have been grouped in the t-SNE plot (black; see Figure S1). All t-SNE visualizations were prepared using the larger first replicate dataset (see STAR Methods for details).
(C) Violin plots showing log-transformed CPM (count per million) values of pervasive and known cell type markers (fold change [FC] > 2; false discovery rate [FDR] < 0.05). Black circles indicate numbers of cells in each major cell type cluster.
(D) Scaled expression of key markers on t-SNEs (one marker per cell type except Lockd and Igfbpl1 for aNSC+TAC+NB).
(E) Violin plots showing pervasive markers for subtypes of microglia, neurons, endothelial cells, mural cells, and fibroblasts. (FDR < 0.05). vSMC, vascular smooth muscle cell.

