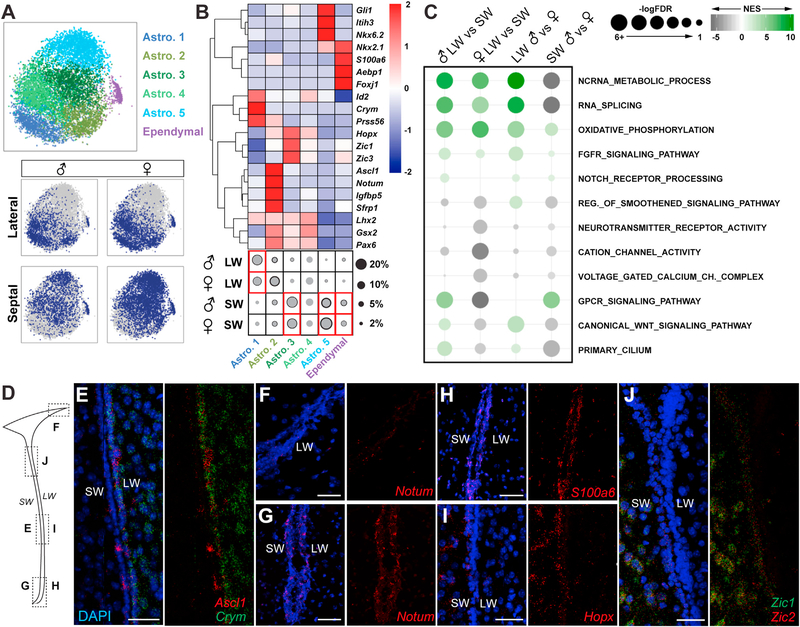
Figure 2. Molecular Characterization of Astrocyte Clusters.
(A) t-SNE projections of five major astrocyte subclusters and ependymal cells and their distribution in different samples.
(B) Heatmap (scaled by row) showing average expression of markers, including TFs and subtype identifiers (FDR < 0.05). The fraction of each subtype is represented with circles (gray, mean; black, mean + SD; two biological replicates). Red box indicates regional enrichment. Astro.4 was not detected in the second replicate due to the lack of subcluster-specific markers, and therefore, black circle was not drawn. LW, lateral wall; SW, septal wall.
(C) GSEA showing significantly regulated molecular processes relevant to V-SVZ NSC biology across four comparisons. NES, normalized enrichment score.
(D) Schema showing coronal section of lateral ventricle and location of RNAscope images in (E)–(J).
(E–J) RNAscope images, with and without DAPI, of (E) Ascl1 (red) and Crym (green), Notum (red) in the (F) dorso-lateral V-SVZ and (G) ventral V-SVZ, (H) S100a6 (red), (I) Hopx (red), and (J) Zic1 (green) and Zic2 (red). DAPI is in blue.

